Summarize this article with AI
Organic clicks are down this week. There's a Slack ping waiting on an answer before end of day. A core update, a mistuned title tag, AI Overviews grabbing clicks: something's going to catch the blame, and fast. Done right, SEO data analysis beats a guess, as long as you read Search Console in the right order.
Five steps run the diagnosis. Confirm the two periods are comparable. Find which pages carried the change. Split each group's shift into an impressions part and a CTR part. Run each competing explanation through a check that could rule it out. Pick what you'll do next, and decide upfront what result would mean you got it wrong. The worked example runs on invented numbers, so the math is right there on the page. No tool roundup, no metric encyclopedia.
Where the Performance report stops short (clicks for AI features, the results your competitors added), we say so. Here's how to tell an observation from a cause.
What is SEO data analysis?
In practice, SEO data analysis means taking what Search Console reports (clicks, impressions, CTR and position, by page and by query, which together make up its SEO metrics) and compressing it to one decision. For most sites, the daily version answers one question. Traffic moved. Where did it move, which metric drove the shift, what explains it, and what do you do next?
People mix it up with a couple of other jobs, so here's the distinction. Reporting describes what happened. For the weekly scan that catches movement, read our SEO dashboard guide. For the stakeholder write-up, head to our monthly SEO report post. An audit sweeps the whole property against a checklist, so technical SEO, meta descriptions and on-page tags, your backlink profile, page speed, content quality, all of it. Analysis locks onto one shift in SEO performance and explains it.
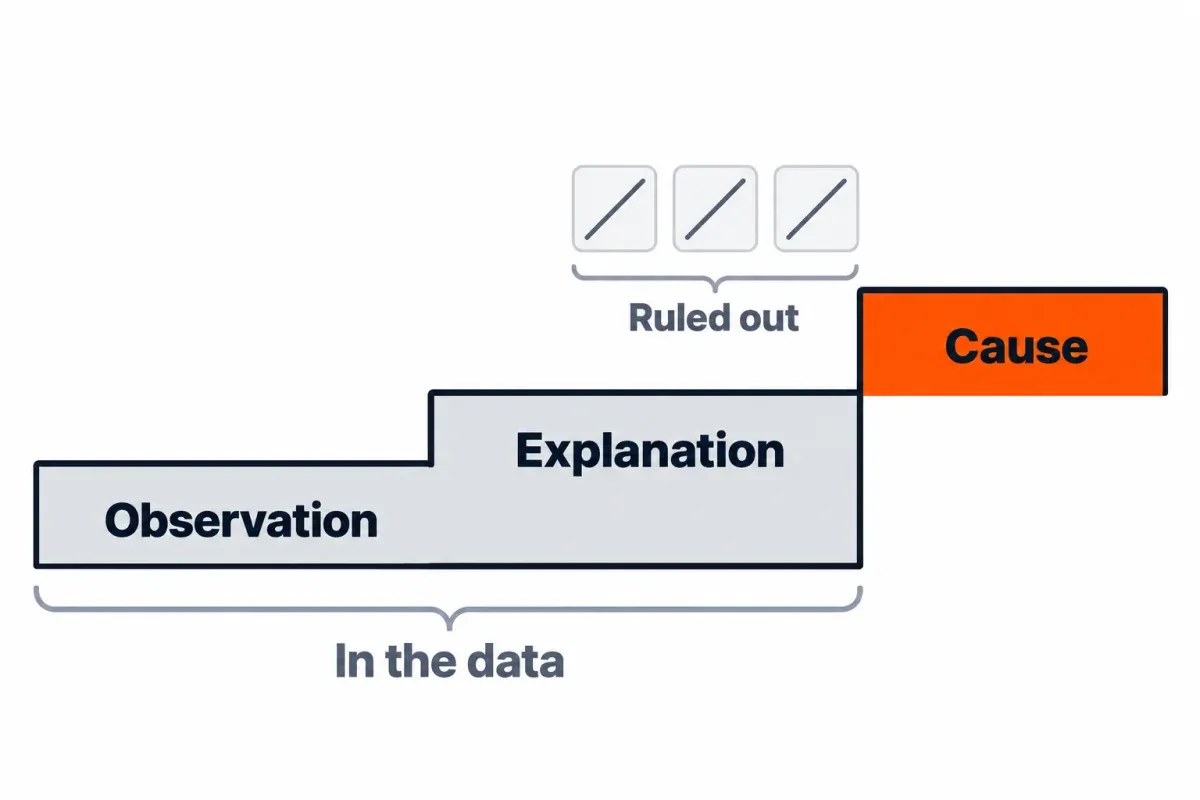
Keep three things separate as you work. An observation (clicks to /guides/ fell 28%). An explanation (CTR fell at a steady position). A cause (a new results-page feature took the clicks). Search Console gives you the first two directly. The third is something you argue for by ruling the alternatives out.
Five steps run the whole thing:
- Confirm the two windows actually line up.
- Find where the change sits.
- Split that group's move into what came from impressions and what came from CTR.
- Write down the explanations that could fit, and for each, pick the check that would rule it out.
- Pick the next action, and the result that would prove you wrong.
Search Console is the main instrument, because it's Google's own count of what searches showed your pages and what people clicked. Analytics sessions are a separate count on a different clock, and the two won't match.1 Start from clicks.
The drop isn't the hard part to find. Holding back on an explanation long enough to earn it, that's the trick.
Step 1: Confirm the two periods are comparable
A line in Search Console wobbles for plenty of reasons that have zero to do with your site. Rule those reasons out first. Spend five minutes here. It can save you a week of chasing a drop that was never real.
| Check | Why it matters | How |
|---|---|---|
| Complete days only | Google says collected data is usually available in two to three days, and the newest day in the chart can be preliminary (shown as a dotted line). A window ending today understates clicks. | End both windows at least three days ago. |
| Same length, same weekdays | Weekday and weekend searches differ, so a Monday-to-Monday run against a Friday-to-Friday run isn't apples to apples. Google suggests weekly or monthly granularity to neutralize the day-of-the-week effect. | Compare whole weeks (Search Console's weeks run Sunday to Saturday) or whole calendar months. Not a partial month against a full one. |
| Same search type | Web, Image, Video and News are separate search types in the Performance report. Since late September 2026, Web itself is split into "Web: text-based" and "Web: multimodal" (Lens, Circle to Search, uploaded images). | Pick the same type on both sides, and name it in your notes. |
| Known data issues | Google lists logging and processing problems on the Data anomalies page and as system annotations on the chart. The current big one: a logging error affected impressions, and with them CTR and average position, from May 13, 2025 to April 27, 2026. Clicks weren't affected. | Check the Data anomalies page and the chart's annotations for your window. If the comparison reaches back into that period, compare clicks year over year, and compare impressions and CTR only back-to-back. |
| Seasonality | The same dip may show up every year. | Open the last 16 months by week or month before comparing two windows. The shape tells you whether this week is unusual. |
| Chart vs table totals | The chart is aggregated by property; the Pages table is aggregated by page. Page rows don't sum to the chart total. | Compare page groups with each other, not with the chart. The group-vs-group comparison is the one that makes sense. |
| Row cap | The UI table and its export stop at 1,000 rows. On a bigger site, long-tail pages fall off. | Pull the page rows through the Search Console API, or use the bulk export once the table runs short. |
Any check fails? Fix the comparison and look again before anything else. Most "it dropped on Monday" messages end right here.
And no, a Search Console line won't climb smoothly week after week. Weekday mix moves it. Holidays, seasonal queries, ranking churn, same thing. Noise, until the dip pushes past where that line usually wobbles.
Step 2: Find where the change sits
Open the Performance report. Turn Compare on. Set the last 4 complete weeks against the prior 4. If you've got last year's data, run a second comparison against the same weeks last year, clicks only. In the Pages tab, sort by Clicks Difference. On most sites, that one sort answers the "which pages?" question.
Then flip through Countries, Devices and Search appearance. If the damage all sits in one country, or on mobile, your list of possible causes just got shorter.
Group pages into sections next. URL folder works (/guides/, /news/, /product/). Page type works too (post, category, product). Sum clicks and impressions per group in a sheet. Google's traffic-drop guide asks a simple triage question. Did the drop hit one important page, a cluster of pages, or every URL on the site?2 Each answer sends you somewhere different:
- One important page: open URL Inspection on it.
- A group of pages: open URL Inspection on a handful of samples from the group.
- The whole site: open the Page indexing report.
Picture a site that dropped 2,000 clicks across two four-week windows. Here's how the groups land (numbers invented throughout):
| Page group | Impressions before | Clicks before | CTR before | Impressions after | Clicks after | CTR after | Change in clicks | Share of the net change |
|---|---|---|---|---|---|---|---|---|
| /guides/ | 200,000 | 5,000 | 2.5% | 180,000 | 3,600 | 2.0% | −1,400 | 70% |
| /news/ | 60,000 | 3,000 | 5.0% | 40,000 | 2,000 | 5.0% | −1,000 | 50% |
| /product/ | 25,000 | 2,000 | 8.0% | 30,000 | 2,400 | 8.0% | +400 | −20% |
| Total (page sums) | 285,000 | 10,000 | 3.51% | 250,000 | 8,000 | 3.20% | −2,000 | 100% |
Two groups account for more than the whole net loss, because the third grew. When one group grew, the losing groups' shares add up to more than 100%. That's expected. A clean "site down 20%" headline buries two different problems. One lives in /news/, the other in /guides/. They'll want different fixes.
Totals aren't the whole story, so check the shape over time too. A one-week step down points to a dated event: a deploy, a migration, a data anomaly, or a Google update noted on the Search Status Dashboard.3 A slide over several weeks fits gradual causes. Google notes that a misplaced noindex causes a slower drop because it depends on recrawling. Shape is a clue, not proof.
SEO Heatmap fits here. Pop the Pages heatmap open and you see each page's clicks sliced into weeks (16 of them), months (Search Console retains 16), or quarters. A slow slide looks nothing like a one-week cliff there. The falling filter surfaces every page losing clicks. A URL filter pins the view to one folder, which happens to be the group you're about to dig into. It's free for one Search Console property. Impressions and CTR still come from Search Console's Pages tab.
Check whether the clicks moved to another URL
Clicks and impressions in the Performance report land on the canonical URL Google picks, then get grouped by the final address after any redirects. If Google picks a different canonical, or you redirect and merge URLs, the clicks jump rows. One shrinks, another swells. Nothing vanished. It just moved.
Check two things. Did the group (or site) total fall by the same amount as the page did? Does another URL gain roughly what this one lost? URL Inspection shows the Google-selected canonical. If the group total held, it's a reassignment, not a loss. Fix it only if the new URL isn't the one you wanted ranking. Our guides on Duplicate Without User-Selected Canonical and 301 vs 302 redirects go deep on each.
Step 3: Split each group's change into impressions and CTR
Clicks are impressions times CTR. So a clicks change traces back to one of three things: impressions moved, CTR moved, or both did. Whichever side carried most of the shift points you at the explanations worth testing first. Impressions point to demand, rankings or coverage. CTR at the same impressions points to the results page, your snippet, or a small position slip.
Use these two formulas. I is impressions, CTR is a decimal, 1 is before, 2 is after:
- Impressions side: multiply (I2 − I1) by (CTR1 + CTR2) / 2.
- CTR side: multiply (CTR2 − CTR1) by (I1 + I2) / 2.
Sum the two parts. You'll land on the clicks delta exactly, nothing floating.
Running that on the Step 2 example:
| Group | Impressions part | CTR part | Change in clicks |
|---|---|---|---|
| /guides/ | −20,000 × 2.25% = −450 | −0.5 points × 190,000 = −950 | −1,400 |
| /news/ | −20,000 × 5.0% = −1,000 | 0 | −1,000 |
| /product/ | +5,000 × 8.0% = +400 | 0 | +400 |
| Total | −1,050 | −950 | −2,000 |
Row by row: /news/ lost clicks entirely through impressions. /guides/ lost most of its clicks through CTR: −950 of its −1,400. /product/'s gain came from impressions.
That's where each change came from, not why. The "why" is Step 4.
Do the split per group, not on the site total
Run the same formula on the site total and you get impressions −1,174 and CTR −826. A different story. The site CTR also moves when the impression mix shifts between groups with different CTRs, even if no group's CTR changed.
Here's the counterfactual that shows it. If /guides/ had kept its 2.5% CTR, the after-period would have 4,500 + 2,000 + 2,400 = 8,900 clicks and a site CTR of 3.56%, up from 3.51%, with no group's CTR moving at all. The impression share just shifted. On a different site, that mix shift can tilt the site CTR the other direction and conjure a "sitewide CTR drop" when nothing of the sort actually happened in any group.
The rule is simple. Decompose by group (or by query), and only then add things up. A site-level CTR change on its own isn't evidence that snippets got worse.
Never average CTR or position across rows
If you're combining rows by hand, recompute CTR from total clicks over total impressions. Weight position by impressions too. A plain average across row values gets it wrong the moment rows differ in size.
Two made-up queries make it concrete. Picture Q1 at 9,000 impressions, position 2, CTR of 10%. That's 900 clicks. Q2 sits at 1,000 impressions, position 12, 1% CTR. That's 10 clicks. Combined CTR? 910 over 10,000, so 9.1%, not the 5.5% a plain row average coughs up. Impression-weighted, position lands at 3.0. Row-averaged, 7.0.
Now bump Q2 up to 9,000 impressions. Nothing else moves. Clicks tick from 910 to 990. Combined CTR drops to 5.5%. Weighted position goes from 3.0 to 7.0. No ranking moved. The averages moved because the mix did.
Search Console's own average position does the same thing. Impressions weight the average, which draws on your topmost result's position. Even Google steers you toward clicks and impressions trends, away from position on its own. A worse site-level average position is reason to drill into specific queries. Not a verdict.
Step 4: List the explanations and try to rule each one out
Jot down every candidate explanation first. Testing comes after. They fall into four families:
- Measurement, meaning numbers moved but no actual traffic did.
- Demand fell, with fewer searches overall.
- Results page: your position held, the page around you changed.
- Your site, meaning rankings, indexing, URLs, or snippets.
Look for the check that could disprove each one. Not the check that props up your first hunch. An honest analysis says when something isn't the cause.
| Pattern | Explanation | You'd expect to see | Ruled out if |
|---|---|---|---|
| CTR down, impressions steady (/guides/) | Small position slip on the same queries | Worse impression-weighted position on queries present in both windows | Position on those queries held |
| CTR down, impressions steady | Results-page change (an AI Overview, new features, a rival's rich result) | Same position, lower CTR on specific queries; higher AI-feature impressions for those pages in the Generative AI report; the live results page shows the new element | CTR held on queries whose position didn't change |
| CTR down, impressions steady | Query mix shift | New low-CTR queries adding impressions while CTR on queries in both windows is flat | CTR fell on the queries present in both windows |
| CTR down, impressions steady | Title or snippet change | The drop starts on the date a title or template changed (your change log, a custom annotation) | No title or template change in the window |
| Any pattern | Measurement | The date lines up with a Data anomalies entry or system annotation; impressions or CTR moved while clicks didn't | No anomaly in the window and clicks fell too |
| Impressions down, CTR steady (/news/) | Demand (seasonal or topical) | The same weeks last year dipped too; Google Trends shows the same fall for the top queries | Trends and last year are flat |
| Impressions down, CTR steady | Ranking loss (keyword rankings slipped) | Worse position on queries present in both windows | Positions held on those queries |
| Impressions down, CTR steady | Lost coverage (pages dropped, removed, noindexed) | Pages or queries gone entirely; newly excluded pages in the Page indexing report | Pages still indexed and still getting impressions |
| Impressions down, CTR steady | Reassignment | Lost clicks appear on other URLs (Step 2's canonical check) | Group and site totals fell by the same amount |
More than one explanation can survive. That's a normal result. It tells you which two things to watch, not that the analysis failed.
Compare against something that didn't move
Three outside references are quick to check. Together, they're the difference between a guess and an argument.
The same weeks last year, for clicks only while the anomaly window is in the comparison. Google Trends for the top losing queries, to see whether the drop was only on your site or across the web. And the page groups that didn't drop in the same window. If /product/ held through the same weeks /guides/ fell, a sitewide cause is less likely.
Say you've got a rank-tracking tool (Ahrefs, Semrush) following your target keywords. Pull the keyword rankings for the biggest losing queries while you're in there. Flat ranking in your tool alongside a flat position in the Performance report argues against the ranking-loss story. A drop in both? That backs it up.
Open the live results page for your top three losing queries. Note what's above you now. No other way to spot a new SERP feature or a new rival with your own eyes. Search Console won't show you the other results. For the habit of keeping a control group when you test your own changes, see our SEO dashboard guide.
Go down to queries, carefully
Filter to the page group (URL contains /guides/), open the Queries tab in compare mode, sort by Clicks Difference. You now have the queries driving the group's change.
The query rows won't add up to the group's totals. Two reasons. Queries searched by too few people over two to three months are anonymized and left out of the rows (though counted in the chart totals when no query filter is applied). The UI table caps out at 1,000 rows, too.1
Note what share of the group's clicks the visible rows cover. For anything past the row cap, use the Search Console API or the bulk export. The bulk export doesn't name anonymized queries either, so the "missing" set stays missing.
A query missing from one window isn't zero clicks. It may be below the anonymization threshold or past the row cap. Compare queries present in both windows for position and CTR, and treat the rest as unknown. Weight position by impressions when you sum, as the previous section showed.
Our Google Search Console regex cheat sheet helps if you want branded, non-branded or question queries isolated before you compare.
When CTR falls at a steady position, look at the results page
A CTR drop on queries whose position held is the pattern a new search engine results page (SERP) element produces. Check two places.
The live results page for those queries, in a clean browser. Note any AI Overview, new rich result, video carousel, shopping module. Anything that pushes your blue link down the page without changing your rank.
Then open the Generative AI performance report. Since August 31, 2026, it's live on every property with enough AI-feature impressions. It shows impressions in AI Overviews and AI Mode by page, date, country and device.4 If those pages' AI-feature impressions rose in the same window their CTR fell, that's consistent with the layout explanation.
What that report can't show: there's no clicks metric and no query dimension, so you can't measure how many clicks the AI Overview took from you. For scale, Pew Research Center's 2025 study found users clicked a traditional result in 8% of visits when an AI Overview appeared, against 15% without.5 That's a population average, not your site's number, and it's one input to the decision in Step 5.
Step 5: Choose the next action, and the result that would prove you wrong
For each explanation that survived Step 4, pick an action and write down the result that would show the action worked. That's the honest version of "monitor and adjust."
| What survived | Next action | What should happen if you're right |
|---|---|---|
| Measurement | Annotate the chart (a custom annotation, up to 200 per property), re-run the comparison on clean windows, change nothing on the site | The drop disappears in the clean comparison |
| Demand | Leave the pages alone; adjust the target or the forecast | Clicks track Trends and last year's curve back up when demand returns |
| Results-page change | Rewrite titles or snippets only where the snippet reads weakly for the new layout; otherwise accept a lower CTR on those queries and report it that way | CTR on the same queries at the same position recovers at least partly; if it doesn't, the layout explanation stands |
| Ranking loss | Compare your page with the competitors ranking above it for those keywords, then improve the page. For a slip of a few places on a page already performing well, Google advises against radical changes | Position on the queries present in both windows recovers |
| Lost coverage | Fix the indexing problem (a noindex you didn't mean, a robots block, removed pages), check with URL Inspection | Impressions return as the pages are recrawled, which can take a while |
| Reassignment | Nothing, if the new URL is the one you want ranking; otherwise fix canonical and redirect signals | The group total stays flat while the rows settle |
The habit worth building: write the expectation and a review date down before you change anything. A custom annotation does it inside Search Console. If the result doesn't come by that date, the explanation was wrong, and you go back to Step 4. Don't stack a second fix on top of a first one that didn't land, because then you can't tell which did what.
Our SEO KPIs guide covers the wait-fix-retarget decision in more depth, and our quick wins checklist covers the matching-windows check after a fix. No universal recovery times here. Google says some changes take effect in a few days and others in several months, with no guarantee.
What Search Console data can't prove
Timing isn't cause. Google writes that it can be difficult to tell whether a change you made directly caused an improvement, because other events (news, shifts in user sentiment, a competitor's improvements) can also contribute. Google's own method is to check whether the improvement lines up in time with your change, compared with similar periods in the past.6 That's evidence, not proof.
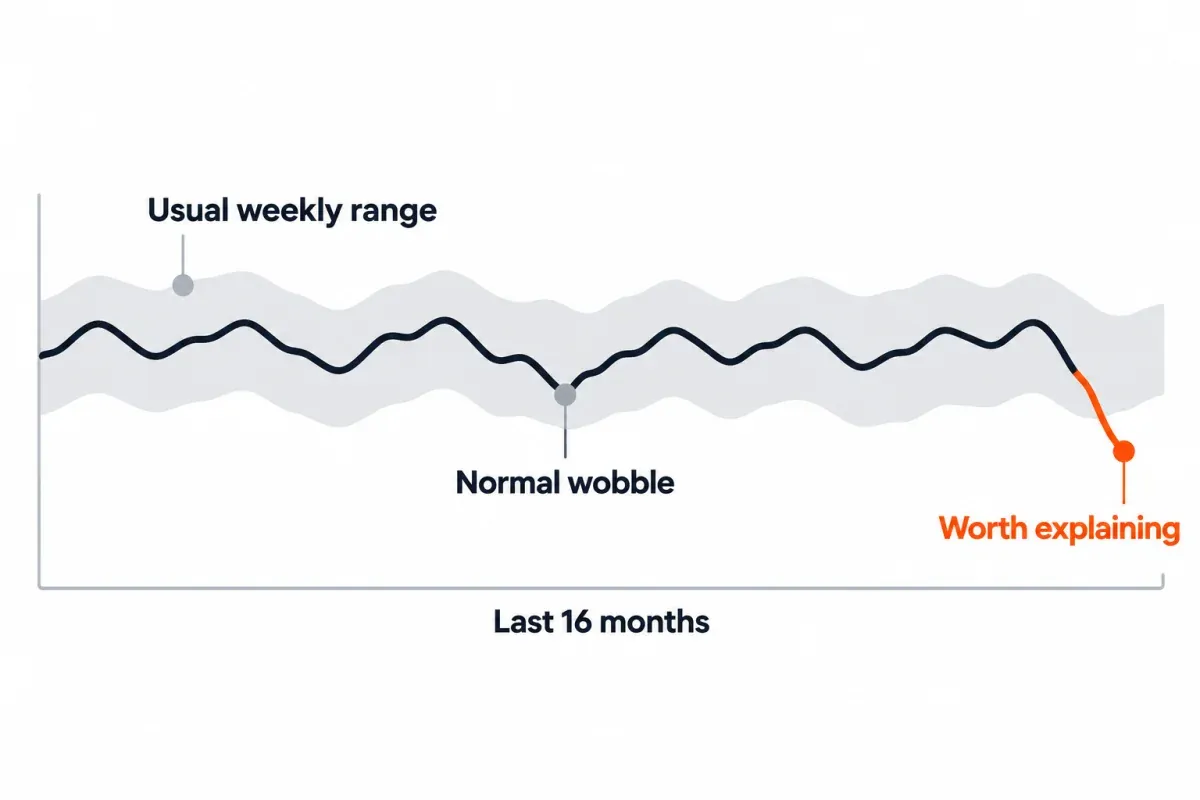
No universal threshold tells you what counts as a "real" drop. Lean on the group's own history: how much it tends to wobble week over week across the last 16 months. A change inside that range needs another week of data before it needs an explanation.
Clicks the AI Overview took? Not in Search Console.4 The extras a competitor stacked above your result? Also missing. Why a searcher scrolled past? Nowhere. Some of that gap, third-party SEO tools fill in. These tools catalog which SERP features show up and sample competitors' keyword rankings using their own query lists. Treat their visibility numbers as a sanity check, not a replacement. The live results page and the outside references in Step 4 fill some of the rest, not all of it. Analytics sessions and Search Console clicks won't match on any site either, so for diagnosing search, start from clicks (here's why the two counts diverge).
SEO Heatmap is free for one Search Console property, and its Pages view spots which URLs stepped down versus slid, by week, month or quarter. It won't replace the Performance report's compare view, but it tells you where to point that view next.
Frequently asked questions
How is SEO data analysis different from SEO reporting?
Reporting runs through what happened over a period, usually on the same template month after month. Analysis takes one specific change, explains it, and lands on a decision. Both work from the same data in Search Console, but the shape of the output is different.
What data do you need for SEO data analysis?
Start in Search Console's Performance report. You want clicks, impressions, CTR and position, broken out by page and query, across the window in question plus a comparable one. Analytics covers what happens after the click (scroll, read, convert). You'll want it once you've picked an action, not before. Google Trends is the cheapest outside reference for demand.
Should I compare with the previous period or the same period last year?
Both, when your history goes back far enough. The previous period catches short-term changes (a deploy, a layout tweak, a sudden ranking move). Same period last year picks up seasonality. Peek at Search Console's Data anomalies page first. If a known logging issue sits inside either window, run clicks year over year and keep impressions and CTR on back-to-back periods.
Why don't my query rows add up to the total clicks?
To protect searcher privacy, Search Console strips low-volume queries from the table. Those rows just don't appear. The UI table also tops out at 1,000 rows. With no query filter on, anonymized clicks still land in the chart total. That's the gap between chart and rows. A missing query is unknown, not zero. Keep that distinction.
Does a worse average position mean my rankings dropped?
By itself, no, because that number is impression-weighted. Say a query ranking deep picks up more impressions. Your average position gets worse, with nothing in the actual rankings moving. Compare position on the queries present in both windows, weighted by impressions, before concluding anything about rankings.
Can I do SEO data analysis with free tools?
Yes. Search Console plus a spreadsheet plus Google Trends covers almost everything this guide walks through. SEO Heatmap is free for one Search Console property. Its Pages heatmap plots clicks by week, month or quarter, so slow slides and one-week steps jump out faster. A paid rank tracker brings in a second read on keyword rankings for the losing queries. Ahrefs, Semrush, that kind of thing. You don't need one to do the analysis.
How soon after a drop should I start analyzing?
Let the window close first. Search Console data lags by a few days. The newest day on the chart can still be preliminary. Jump into the compare view before that and you'll understate recent clicks, then chase a dip that fills in by morning.
Knowing which pages to compare before you open the compare view helps a lot. SEO Heatmap puts every page's clicks by month, week or quarter on one screen, with a falling filter that lists the pages losing clicks and a URL filter for each section of the site. It's free for one Search Console property.
Sources (6)
SEO Heatmap Knowledge relies on primary sources: Google's documentation, web standards, peer-reviewed research, and vendors' own pages for their pricing and features. Our editorial standards
- Google Search Console Help. “Performance report (Search results): Troubleshooting data discrepancies.”
- Google Search Central. “Debug Google Search Traffic Drops.”
- Google Search Central. “How to use the Google Search Status Dashboard.”
- Google Search Console Help. “Generative AI performance report (Search).”
- Pew Research Center. “Google users are less likely to click on links when an AI summary appears in the results.”
- Google Search Console Help. “Performance report (Search results): Common tasks and use cases.”