Summarize this article with AI
Someone asks what organic traffic looks like next quarter. A range you can defend. Not one tidy number. Lean SEO forecasting on your own click history and it holds up. Lean on a borrowed click-through curve and the ground gets shaky fast.
Start with the history you have. Search Console offers up to 16 months of clicks per page; newer properties may have less. Pull a baseline from that history. Draw a straight line through it. Wrap a low/base/high band around the line. Backtest on months you've already lived through. Only then does any of it reach an audience. Just want the template? It's in section two. Copy that and skip ahead.
Here's the method.
What SEO forecasting is, and what good looks like
Here's SEO forecasting in plain terms. You're estimating organic clicks for a site, section or page across a coming window, drawn from past performance and the assumptions you've written down about what shifts next. It's a range plus assumptions. Not a promise.
A forecast earns trust on four counts. You hand over low/base/high, not one tidy figure. It covers a short horizon you can defend. It writes its assumptions down beside each case.1 And it gets compared with actuals every month, so the next one lands sharper.
Two families of method exist. The top-down route? Keyword search volume times click-through rate at the position you're aiming for. Many calculators and templates run on that. The bottom-up version works from your history. Each page already earns some clicks. Read the trend inside those, and push it forward.
| Method | Starting point | Good for | Weak at |
|---|---|---|---|
| Top-down | Keyword search volume x click-through rate at a target position | Pages that don't rank yet, new content, new sites | Depends on a generic click-through curve and on volume estimates |
| Bottom-up from your own history | Search Console clicks by page and month | Pages and sections that already pull traffic | Can't see a page with no history, and 16 months is a short runway |
This post teaches the second method. Calculators and templates tend to start from the first, while the data for the second is already sitting in your Search Console account.
How accurate will it be? Test that on your own site. Fit the method on the earlier months, forecast the months you've held back, and measure the difference.2 A short backtest gives you a useful check, not an accuracy guarantee for the next quarter.
Forecast clicks, not rankings. You can't promise position 1 next quarter.3 You can say what the current trend delivers if nothing changes, and what the pages you're working on might add on top.
SEO forecast template: the table to copy and fill
Here's the artifact. Four small blocks, each explained by one section below. Drop it into a sheet next to your Search Console export and fill it in.
SEO FORECAST: [site or page group], [first month] to [last month]
Data: Google Search Console clicks, [16 months, from <month> to <month>], horizon [3] months

1. BASELINE
   Page group | Avg clicks, last 3 months | Notes (spike, update, migration)

2. TREND
   Page group | Clicks per month, up or down by | Seasonal check (months 13-16 vs 1-4)

3. FORECAST
   Page group | Low | Base | High | What High assumes

4. TRACK
   Month | Forecast (low / base / high) | Actual clicks | Inside the band? | Likely cause
Blocks 1 and 2 come straight from the data. Block 3 uses the formulas later in this post. Block 4 gets a new row every month. Work in page groups rather than individual pages. One weird page shouldn't drag the whole site's number around.
The template is built so Search Console data alone can fill it. No third-party database needs to come anywhere near it.
How to forecast SEO traffic from your own data
Here's the whole method in a breath. Pull click history. Clean it until you trust it. Fit a trend. Wrap a range around that trend, then test the lot against months you've already seen. History and the trend get the next three parts below. The range and the backtest follow in the two sections after them.
Pull 16 months of clicks and group your pages
Search Console keeps up to 16 months of Performance data.4 Use the history available for your property; a separate archive may give you more. Leave out the current, unfinished month and any partial month at the start, so each observation covers a full calendar month.
Three ways to get the clicks per page per month. The Performance report's Pages tab, filtered one month at a time, works but is slow and caps each export at 1,000 rows. The bulk export to BigQuery has no row cap, but it only collects from the day you switch it on, so it can't backfill the history you need today (see our bulk export walk-through for the options). Or SEO Heatmap shows clicks per page by month (16 months) or by week (16 weeks) in one grid, flags the growing and falling pages, and exports to Sheets or Excel without the 1,000-row cap. Free for one Search Console property.
Group the pages before you fit anything. A single page tanking can tilt the whole site's line. Grouping soaks that up. Whatever cut fits the site works. Folder works (/blog/, /docs/, /pricing/). Page type works (articles, product pages, categories). Topic works too. Somewhere between five and ten groups usually does the job. Add a separate line for the three to five pages that pull the bulk of clicks. It's a working judgment, nothing more. If a group ends up doing two jobs, split it.
Forecast clicks. Not sessions, not rankings. Clicks give you a consistent metric across the pages returned by Search Console, and keeping one metric from start to finish is what makes the backtest clean. Other tools' traffic numbers won't line up, so stay inside Search Console for the forecast itself.
Check what can be forecast, then clean the baseline
Not every page or group is forecastable from its own history. Run this quick check first, then adjust the baseline accordingly.
| Situation in the history | What it does to a forecast | What to do |
|---|---|---|
| Page or group under about three months old, migrated or redesigned | Its own clicks don't describe its future | Use the top-down method (volume x CTR, with a ramp) for this group |
| One-off spike (launch, press, promotion) | Inflates the trend | Mark the month, then cap it or leave it out |
| Core update inside the window | Can shift traffic levels across affected pages | Flag the month and consider starting the trend after it |
| Flat or erratic history | The trend line is weak | Keep the base, widen the band |
| New SERP feature or AI Overview changed the clicks per impression | Clicks-per-impression has likely moved | Treat the older months as a different regime and say so in the assumptions |
The "about three months" cut-off is a working judgment, not a rule. A spike you can't explain? Don't let the baseline rest on it.
Quiet over-promising tends to show up around seasonality. A full 16-month window gives you at most four year-over-year month pairs, with fewer after you remove partial months. Compare the complete pairs for a rough seasonal read. A change can reflect growth or decline as well as seasonality; four pairs cannot separate those effects reliably. For the shape of a whole year, Google Trends fills in the gap.4 Multiple full years make an annual seasonal pattern easier to assess; sixteen months gives you little repeat evidence. The honest move? A straight line, plus that four-month year-over-year check.
Any cleaning decision goes in the Notes column of block 1. "[Month]: spike tied to [the launch], capped at the 3-month average." Reproducibility lives in those notes. And a stakeholder gets something concrete to push on, beyond the final number.
A straight-line trend inside your spreadsheet
The math is small. Column A gets month numbers (1, 2, 3, keep going). Column B gets each group's monthly clicks. Next month's projection runs off a single formula.
Google Sheets:  =MAX(0, FORECAST(MAX(A2:A17)+1, B2:B17, A2:A17))
Excel:          =MAX(0, FORECAST.LINEAR(MAX(A2:A17)+1, B2:B17, A2:A17))
The ranges above allow for 16 observations; change the last row to match your completed months. FORECAST takes three arguments: the month number you're predicting, the known clicks, and their month numbers.5 MAX keeps the estimate at zero if the fitted line goes negative. Change +1 to +2 or +3 for the following months. For several months in one shot, TREND over a range does the job.6
On horizon: three months out is comfortable. Six months is the ceiling. Judgment call, same as before. 16 months is a short runway. Push a straight line too far past it and the number starts lying to you. A stakeholder wants 12 months? Hand over the three-month range alongside the planned work, and promise a refit at the next quarter.
Fit on the cleaned baseline (flagged months capped or dropped). Then eyeball the trend against the plain average of the last three months. If the two differ sharply, compare both approaches on held-out months. Recent growth, decline or a spike could explain the gap; the comparison alone doesn't tell you which. If neither holds up, shorten the horizon or regroup the pages.
From one trend line to a low, base and high range
One number comes out of a straight-line trend. The range gives you something to defend.
Three cases, each with one definition.
- Base = the no-change projection from the cleaned trend. Nothing changes, the recent trajectory continues.
- Low = Base minus a downside measured in clicks, with a floor of zero. Use the largest month-to-month fall in your cleaned history, or the largest backtest overprediction in clicks, whichever is bigger. For each held-out month, overprediction = MAX(0, forecast clicks - actual clicks). Low = MAX(0, Base - downside). This avoids percentage errors that divide by zero when a month has no clicks.
- High = Base plus the clicks your planned work should earn once it ships (next subsection sizes that up).
That sizing rule is one reasonable approach, nothing more. No industry standard behind it. Band width belongs to your data. A round percentage that felt safe doesn't earn it.
Round numbers below, just to walk the arithmetic. Picture Base at 1,000 clicks a month, with the worst monthly fall in your window sitting at 150 clicks. Low lands at 850. Tack on 200 clicks from the pages you're pushing (once they rank where you want them), and High comes in at 1,200. The stakeholder sees three numbers. 850, 1,000, 1,200.
Write the assumption beside each case.1 "Base: nothing changes. Low: the worst month in our history repeats. High: our three product pages in flight go from average position 11 to average position 6." When a stakeholder pushes back on the assumption column instead of the forecast number, that's the conversation you want.
Each group gets its own range. Sum the groups for a site-wide scenario, then compare that with a trend fitted directly to the site total. The summed Low assumes every group hits its downside together; the summed High assumes every planned lift arrives together. Those are scenarios, not a calibrated confidence interval. Log any gap between the two methods and check which assumptions explain it.
Lead with the Low number when you present the range. The reader's first anchor is the one they'll argue with; make it the one you can defend.
Estimate the high case with your own click-through curve
For pages you plan to push up the SERP, the lift comes from a change in click-through rate at a higher position. The question is which curve to use.
A borrowed curve brings assumptions about someone else's mix of queries. Build a rough curve from your own data, and keep branded queries separate from non-branded ones. Treat it as a scenario input, not proof that moving up a position will produce a fixed gain. In their 2005 SIGIR eye-tracking study, Joachims and colleagues found that clicks were informative but biased.7
Build your site's own curve instead. Two steps.
- Head into Search Console, open Performance, flip to the Queries table, then switch on clicks, impressions, average click-through rate and average position.8 Set the date range to the full 16 months. Export. The interface export is limited to the table rows available in the report, up to 1,000.9 If you hit that limit, treat the curve as a sample of your queries. The Search Console API can provide broader coverage.
- In the sheet, round each query's average position to a whole number in a helper column. Then work out the rate for each position from the totals, not from an average of per-query rates:
=SUMIF(bucket_range, 1, clicks_range) / SUMIF(bucket_range, 1, impressions_range)for position 1, and the same with 2, 3 and so on.
That's your curve. Filter the table to one folder first if a section of the site behaves differently from the rest. Then price the lift for the pages you're pushing:
Extra clicks per month ≈ [expected monthly impressions] x ([CTR at target position] - [CTR now])
Use a recent, representative complete month's impressions for each selected query, or write down how you expect that monthly volume to change. The 16-month export helps build the curve; its total impressions are not a monthly input. Apply the lift only to the queries you plan to improve, and add it to Base in the month you assume the improvement arrives. Count each query-page pair once, so overlapping page and query estimates don't duplicate the same lift.
Two cautions worth saying out loud. Average position is, well, an average. A query that reads as position 3 may have hit 1 some days and 8 on others, so the curve is approximate.10 Buckets with only a handful of impressions throw off the rate. Drop them before one strange row bends the curve.
Backtest the method, then compare forecast with actual
Don't trust a method until you've run it on data where the answer is already known. With 16 months in hand, that's not hard to set up.
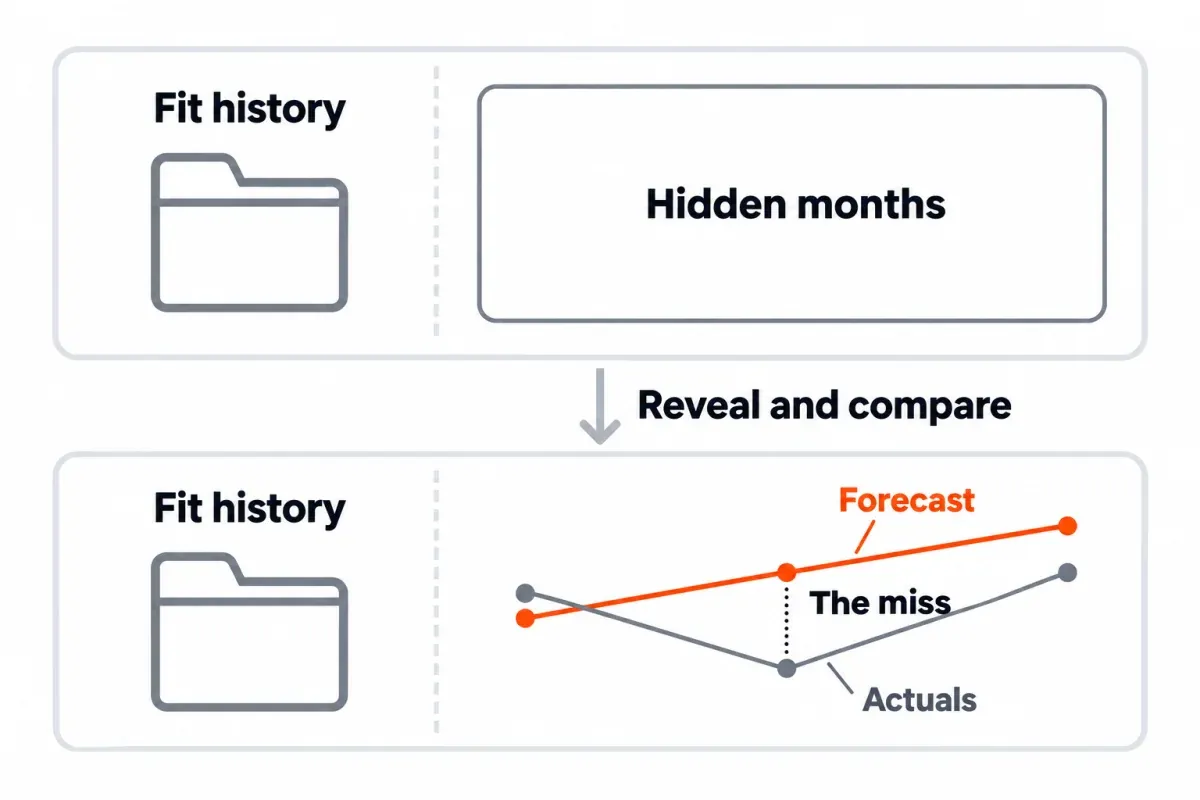
Hold-out backtest. Take the first 12 or 13 months and forecast the last three or four from them. Act like those recent months aren't visible.2 Only then line it up with what actually happened. The miss is your evidence about how wide the Low-to-High band should actually be. Reuse that miss as the Low rule from the previous section. A miss bigger than the band you'd be happy showing a client? Pull the horizon in, or regroup the pages.
From then on, block 4 of the template gets one fresh row a month. Each row holds the forecast low/base/high, the actual clicks, a yes-or-no on whether the actual sat inside the band, and the likely cause when it didn't (think core update, product launch, seasonality). Two months of actuals outside the band? Investigate the assumptions and consider re-fitting the trend. Two months is a practical review trigger, not proof of a statistically meaningful change; unpredictable variation can still explain the misses.
A miss is information. It can reflect unpredictable variation, a bad assumption or a change in the site or search results. Record a suspected cause when you have evidence, and leave it unknown when you don't. That record gives the next review something to test. Our monthly SEO report template already has an actuals row ready, so the forecast fits straight into the same cadence. Our SEO dashboard post covers the charts you can hang on top.
SEO forecasting tools: when a spreadsheet is enough
One site, a handful of groups? A spreadsheet is plenty. The whole thing fits in a single tab, with formulas running no deeper than two functions.
At scale, dedicated features start paying for themselves. Running hundreds of keywords across dozens of pages, or working with a stack of clients? At that point the data wrangling becomes the real job, and SEO suites or rank trackers with forecasting built in start earning their keep. A single site rarely needs one.
SEO Heatmap sits upstream of the forecast. The math still happens elsewhere. Think of it this way. Clicks per page by month across the full 16 months Search Console keeps. Pages trending up or down, flagged. Top gainers and losers surfaced through AI insights. Page-click history exports to Sheets or Excel past the 1,000-row cap. It won't forecast for you, and it holds no more than Search Console does. Free for one property.
If you'd rather run the sheet steps from a chat window, Claude or ChatGPT connected through MCP can read the exported data and do the arithmetic.
How to present an SEO forecast without promising a number
Three lines, every time you send it.
- The range.
- The assumption behind each case.
- When the next review happens.
Paste this fill-in straight into your next report:
Organic clicks over the next [3] months: [low] to [high], most likely [base].
Base assumes [no change]. High assumes [the pages we named move from position X to Y].
We'll compare this with actuals on [date].
Rankings are the numbers you can't promise. Say so out loud. Position moves on what competitors do and on Google's own calls. You control neither. The process is what you can promise. The method. The review date. A willingness to update the next forecast when an assumption breaks.
End on cadence. A fresh forecast each quarter. A comparison every month. A logged reason any time the actual slips past the band. A range alongside a review date reads as a plan. A single number is a bet.
Stuck on pulling 16 months of clicks per page without fighting the 1,000-row cap? That's exactly what SEO Heatmap handles: one grid of monthly clicks per page, a Sheets or Excel export without the interface's 1,000-row cap, and filters for growing and falling pages so you can see which ones are already moving. Free for one Search Console property.
Frequently asked questions
How accurate are SEO forecasts?
There is no accuracy percentage that applies to every site. Test your method on months you held out from the fit, then record how far the forecast missed and whether actual clicks fell inside your range. Use those results to choose the horizon and band width. A range with written assumptions gives you a clearer basis for review than a single promised number.
What forecast horizon makes sense for SEO?
Three months out. Six if you push it. Judgment call. Not a hard rule. Search Console gives you 16 months, which isn't a long runway. Stretch a line that far and the number stops being honest. Asked for 12 months? Give the three-month range plus the review date, and book a refit at the quarter.
Will an SEO traffic forecast work on a brand-new site?
Not off its own history, because the history doesn't exist yet. For pages under about three months old, or anything recently migrated or redesigned, go top-down. Keyword volume times click-through rate at your target position. Then phase the page up to that position across the forecast window. Flag the top-down switch in your assumption column. Once a few clean months are on the board, retire the workaround.
How often does an SEO forecast need updating?
A fresh forecast each quarter. A check against the actuals once a month in between. Any time the actual lands outside the band two months in a row, re-fit the trend. Same if something sizeable shifts (a migration, a core update, a new SERP feature on your main queries). Pushing updates faster than quarterly usually ends up chasing noise.
Clicks, sessions or rankings: which one to forecast?
Clicks. Clicks are the per-page number pulled from one source, so forecast, backtest and monthly check all speak the same metric. Organic sessions can also be forecast, but use a consistently filtered analytics dataset; they measure visits rather than Search Console clicks. Rankings answer to competitors and whatever Google decides to do next. Neither one is sitting in your hands.
Can SEO Heatmap handle the organic traffic forecast?
No. It shows up to 16 months of clicks per page by month, or 16 weeks by week, flags growing and falling pages, and exports to Sheets or Excel past the 1,000-row cap. The trend, the range, the click-through curve, all of that still runs in your spreadsheet. Call it the clean feed into the forecast, not the forecaster.
What's a common mistake in SEO forecasting?
Promising a single number. A single number has nowhere to retreat to when the actual lands somewhere else, and the assumptions behind it stay hidden. Lead with Low, show the full range, write the assumption next to each case and name the review date. An assumption breaks, you correct the forecast, and the method keeps standing.
A forecast is only as sound as the history sitting underneath it. SEO Heatmap puts each page's clicks for the last 16 months in one grid, so the baseline for your next forecast takes minutes to pull. It's free for one property.
Sources (10)
SEO Heatmap Knowledge relies on primary sources: Google's documentation, web standards, peer-reviewed research, and vendors' own pages for their pricing and features. Our editorial standards
- Rob J. Hyndman and George Athanasopoulos, OTexts. “Judgmental forecasts.”
- Rob J. Hyndman and George Athanasopoulos, OTexts. “The forecaster’s toolbox.”
- Google Search Central. “Do you need an SEO?”
- Google Search Central. “Debugging drops in Google Search traffic.”
- Microsoft. “FORECAST and FORECAST.LINEAR functions.”
- Microsoft. “TREND function.”
- Joachims et al., SIGIR 2005. “Accurately Interpreting Clickthrough Data as Implicit Feedback.”
- Google Search Console. “Performance report (Search results): Overview and basic setup.”
- Google Search Console. “Export data directly from a Search Console report.”
- Google Search Console. “What are impressions, position, and clicks?”