Summarize this article with AI
Monthly SEO report due this week? Most templates leave the sentences to you. You get headings and that's about it. Everything here comes from Search Console and whatever change log you keep. The summary gets ready-to-paste wording. The plan has three items, aimed at next month.
Grab the whole template in one go. After that, section by section: numbers to include, numbers to cut, branded versus non-branded, and how a finding turns into one action. Most reports lose their reader at the summary. You'll find a three-sentence skeleton below (and a bad-news variant) that you can fill with your own figures. Here is the template.
Monthly SEO report template: the six sections to copy
Last month in organic search, why it went that way, what you'll do next: a monthly SEO report pins those three on a page. The numbers support that story. They are not the report.
Six sections carry everything a monthly SEO report needs. The summary is section 1. Data lives in sections 2 to 5. Section 6 is the plan. One optional line covers whatever needs a tool other than Search Console. Do sections 2 to 5 first, then section 1 for the summary, and cap section 6 at three plan items.
Copy this skeleton:
MONTHLY SEO REPORT: [site], [month year]
Data: Google Search Console, [date range], compared with [last month] and [same month last year]

1. SUMMARY
   - What changed: [one sentence]
   - What drove it: [one sentence]
   - What we do next: [one sentence]
   - If there is bad news: [one sentence saying what we know, what we do not, what we are doing]

2. CORE NUMBERS
   Metric             | [Month] | [Last month] | Change | [Same month last year]
   Clicks             |         |              |        |
   Impressions        |         |              |        |
   Non-branded clicks |         |              |        |

3. PAGES THAT MOVED
   Top 3 gained:
   - [page] +[N] clicks, [reason or "reason not confirmed"]
   Top 3 lost:
   - [page] -[N] clicks, [reason or "reason not confirmed"]

4. QUERIES
   Top 5 non-branded queries:
   - [query] | [clicks] | [average position]
   Page-two queries worth a push (positions 11 to 20):
   - [query] | [position] | [impressions]

5. WHAT WE CHANGED THIS MONTH
   - [date]: [page or sitewide change]

6. NEXT MONTH
   - [page or query] | [action] | [metric we will check, by when]
   - [page or query] | [action] | [metric we will check, by when]
   - [page or query] | [action] | [metric we will check, by when]

OPTIONAL (only when you track it): conversions, backlinks, technical health, AI visibility.
The sections below explain each block and hand you the wording.
Write the summary last: an SEO report example in three sentences
A summary heading alone does not tell you what to write. In the reader's first minute, the summary has to answer three questions: what changed, what caused it, and what happens next.
Here's a skeleton to lift. Fill the brackets and leave the shape alone:
Clicks from organic [rose/fell] by [X]% to [N] compared with [last month], and [Y]% compared with [same month last year]. Most of the change came from [page or query group], after [a change we shipped / a seasonal pattern / a cause we have not confirmed]. Next month we will [action 1], [action 2] and [action 3].
Three sentences. One number, one reason, one plan. The numbers stay in brackets because the template is yours to fill, not an example to copy figures from.
Bad months get their own three lines. State what you know, what you don't, and what you're doing about it:
Clicks fell [X]%. [N] of the [M] lost clicks came from [page]; we have not confirmed why. We are [checking X] and will report next month.
"Cause not confirmed yet" is a real answer. Guess the cause and you'll lose more trust than if you'd just said you're still checking.
Writing for someone who isn't an SEO? Swap the jargon:
| What an SEO writes | What a non-SEO reader hears |
|---|---|
| Queries | What people typed to find the site |
| Impressions | Times the site showed up in results |
| Average position | How high it showed up, on average |
| Non-branded | People who found us without searching our name |
Keep both columns around. The left one goes in your working copy. The right one goes in anything a boss or a client reads.
The core numbers table: what goes in and what gets cut
Section 2 of the template is a three-row table pulled straight from Search Console's Performance report. Each row earns its spot for its own reason.
| Number | Where it comes from in Search Console | Why it is in |
|---|---|---|
| Clicks | Performance report, Search results | The result: whether people came |
| Impressions | Same report | The demand: whether the chance was there |
| Non-branded clicks | The Query filter, with branded queries excluded | Traffic from searches that do not include your brand name |
For the comparison columns, head into Performance, apply a Date filter, click Compare, and set the month against the one before it. A Difference column pops up, lining up the two periods row by row.1 Want the same month last year? Set a custom date range for that month, twelve months back. Search Console keeps up to 16 months of history.2 If your property has collected data that long, last year's figures are there to compare. Our SEO dashboard guide explains each metric in more depth.
Here is the cut list most templates skip:
- Sitewide average position. It averages the topmost position of your site across impressions.3 A change in which queries get impressions can move it even when existing rankings hold steady. Read position per page or per query instead (section 4).
- Sitewide CTR. It can fall when extra impressions bring few clicks.4 Nothing on your site has to change for it to drop.
- Total keywords or queries counted. The number moves on its own and tells you nothing about what to do next.
- Any number you will not act on. If no page would get touched because of it, it does not belong in the report.
- Any number that does not change month to month. Dead weight on a one-page document.
Pick the same metrics every month. Two months laid side by side, read in the same order: that's where the report earns its keep. Adding a new number? Only if you plan to keep it for six months.
One rule holds the whole data section together. Every headline number shows last month and the same month last year, and before any change gets a sentence in the summary, run three questions past it:
- Is it seasonal? Did the same month last year do the same thing?
- Is it one page or the whole site?
- Did we ship anything that could explain it?
Set your own threshold for the size of change that deserves a sentence. There is no honest benchmark that fits every site.
Pages that moved: the month-over-month view
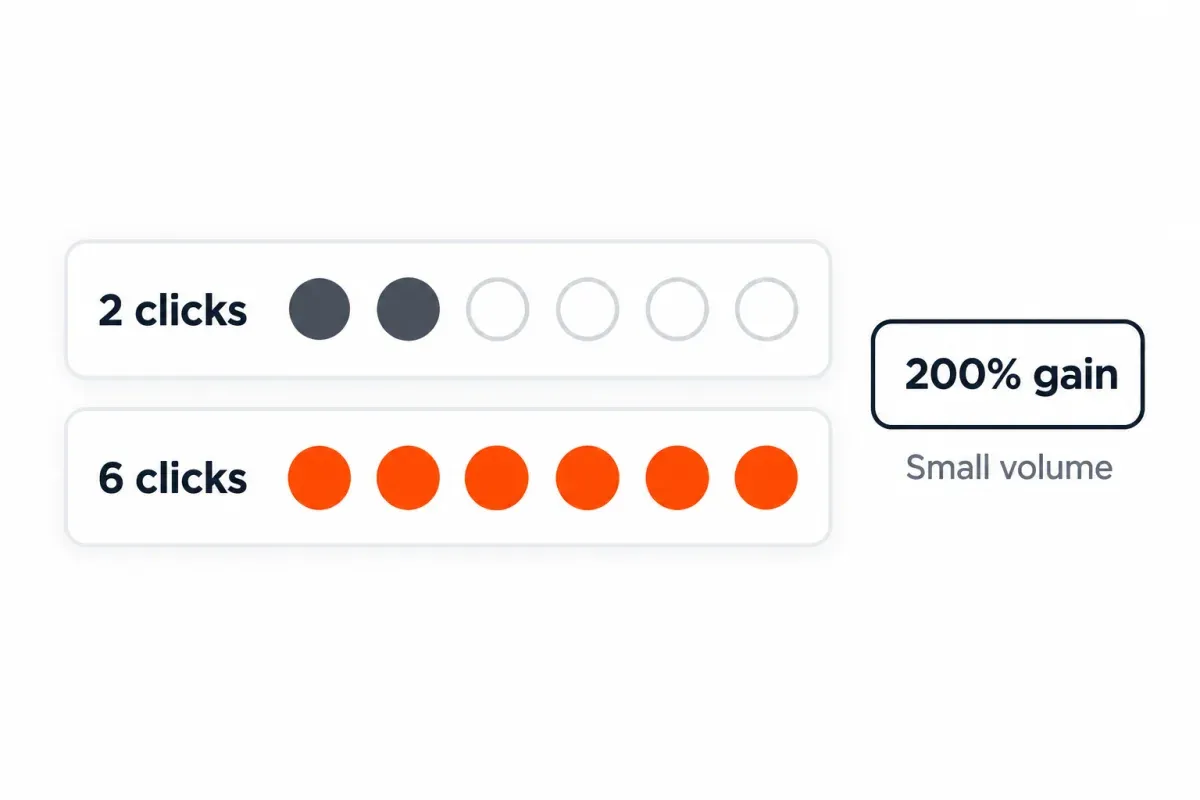
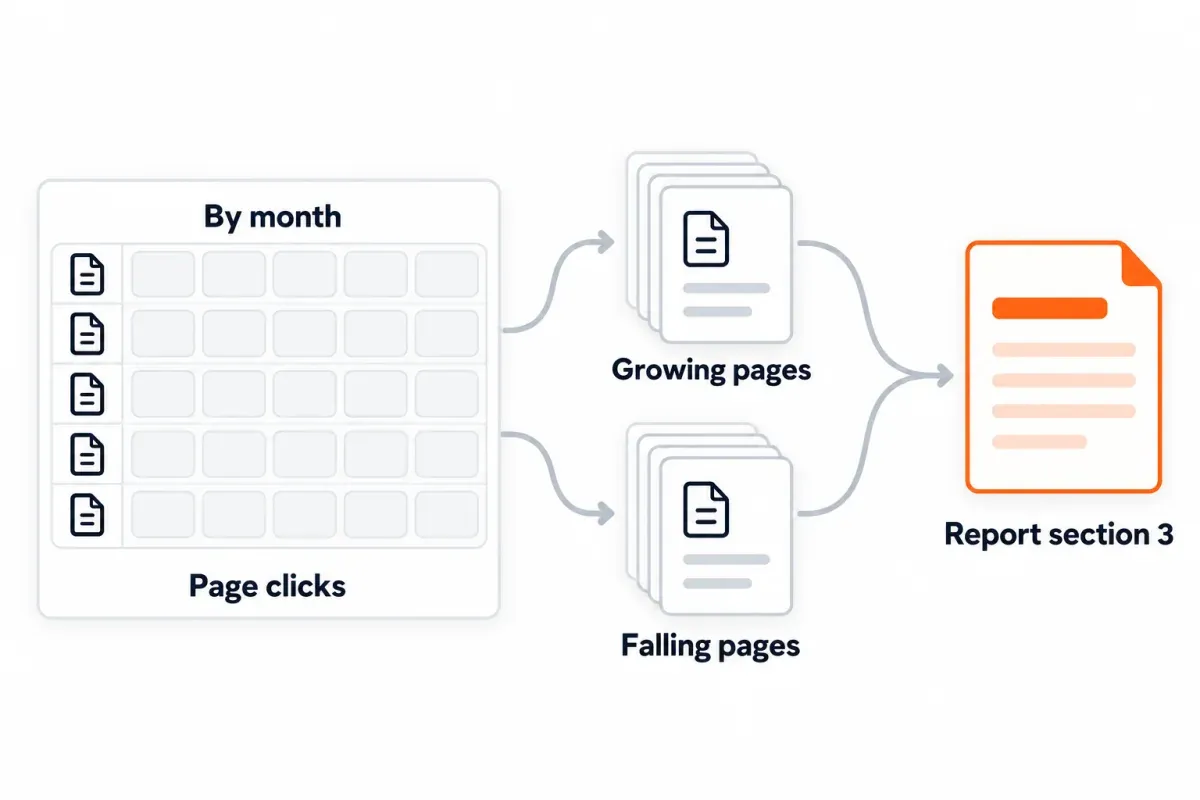
Section 3 of the template is six pages: three gainers, three losers, ranked by clicks gained or lost. Not by percentage. A page that went from two clicks to six is a 200% gain and a rounding error.
Two routes get you the list.
From Search Console directly. In the Performance report: Pages tab, Date filter, Compare, then last month against the month before.1 Big swings jump out of the Difference column. Large positives are your gainers; large negatives, your losers.
From SEO Heatmap. It is free for one Search Console property. Each page's clicks sit in one grid, by month across 16 months or by week across 16 weeks. Its growing and falling filters pull the gainers and losers without a manual compare, and the AI insights name the top movers. The heatmap shows clicks; impressions and average position per query live in its Keywords tab.
For each mover, write one sentence with one of three honest reasons:
- "We changed it" (pull the date from section 5).
- "Seasonal" (the same month last year moved the same way).
- "Not confirmed."
One sentence per page. This is where reports lose their reader when they pad.
If several pages lose clicks in the same month, check whether the drop affects the whole site or just a group of pages.2 Review section 5's change log before deciding which pages need work.
Queries: split branded from non-branded and find the page-two ones
Section 4 of the template answers two questions: how branded and non-branded traffic compare, and which queries sit close enough to page one to matter next month.
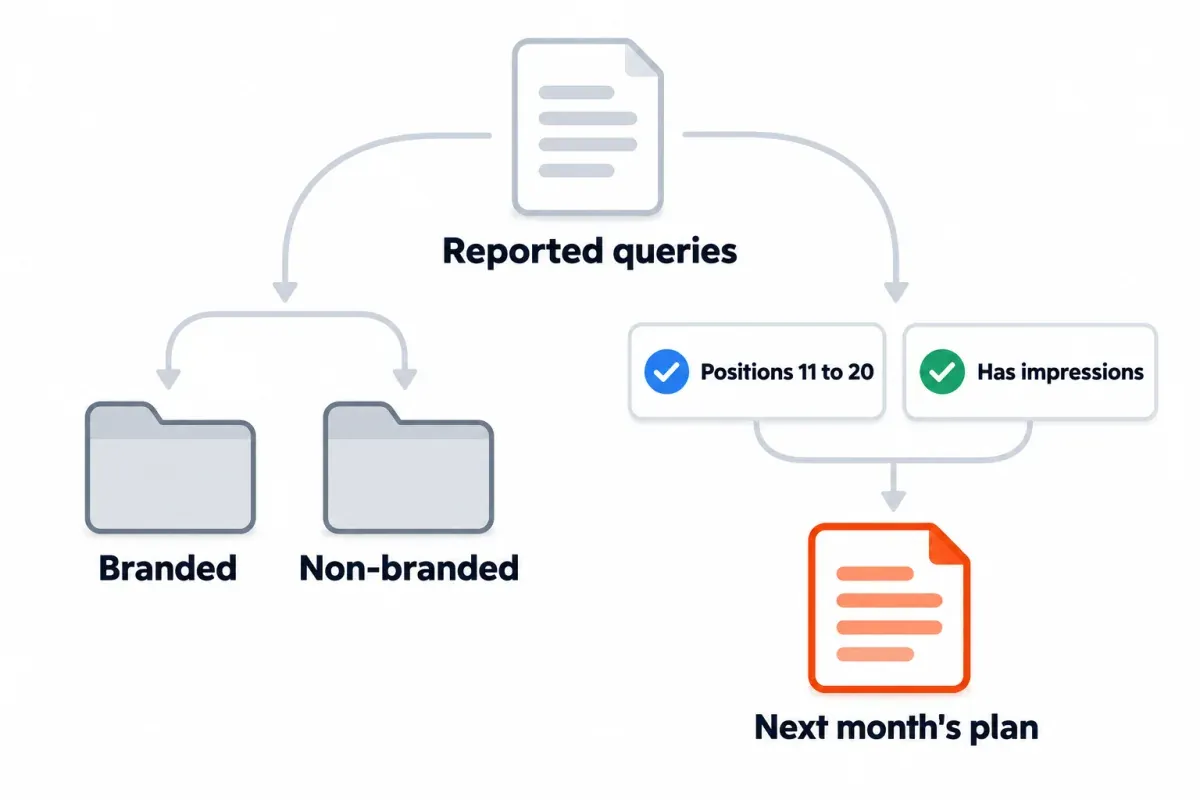
Why the split? Branded queries include your company name, domain, or a brand-specific product or service, and often come from people who already know you.5 Non-branded clicks can show you reaching new readers, though neither group proves what caused the traffic. Put the non-branded number on the front page so a rise in brand searches does not hide a change in it.
There's a branded-queries filter now in Search Console's Performance report. Open the Query filter and look for a Branded or Non-branded option.5 If it is there, use it.
If it is not, fall back to a regex filter. Google says the branded filter is not available for sub-properties (a property set up for one folder, like /blog/) or for sites with few impressions, so those sites can use regex as a fallback. Add a Query filter, pick "Doesn't match regex", and type a pattern that covers your brand name and the common misspellings.6 Our Google Search Console regex cheat sheet has patterns to start from.
List the top five non-branded queries with their clicks and average position. Average position is read per query here, which is the one place in the report it earns its space.
For the page-two queries, filter the Queries tab for rows whose average position sits roughly between 11 and 20 and that have real impressions. The 11 to 20 range is this article's working line for "just off page one", not a Google term. These rows feed section 6: a query close to page one with impressions is a lead for next month's work. SEO Heatmap's Keywords tab shows the same three numbers (clicks, impressions, average position) per query, with its own growing and falling filters.
One caveat worth stating once. Search Console hides some queries for privacy, so the query rows may not add up to the chart's clicks total.4 Query filters also remove those hidden queries from the chart totals. Compare the same dates and filters, and note the gap instead of trying to force the two totals to match.
Next month's plan: turn each finding into one action
Section 6 of the template? Three items. Give the reader actions they can check next month. The table below gets from a finding to an action.
| What the report shows | What to do next month |
|---|---|
| Queries at positions 11 to 20 with impressions | Improve the page the query lands on, add internal links from related posts |
| A page with high impressions and low clicks | Rewrite the title and meta description |
| A page losing clicks month over month | Check for thin or outdated content on it |
| A page gaining | Note what changed, so you can repeat the move |
| A sitewide drop | Check what shipped that month before touching any page |
Our thin content guide walks the losing-clicks case step by step.
The plan itself keeps a fixed shape, and that part is our opinion, not a convention. Three items, each a page or query, an action, and the metric you will check in next month's report. Three, because the reader of a monthly report acts on a few things, and next month's report has to say whether they worked.
That's the line that turns a report into a record. Open next month's summary with a question. Did last month's three actions actually move anything? A monthly series without that line never compounds.
Save the wider review of goals, effort and overall impact for a separate quarterly document. Keep the monthly report focused on what changed and what to do next.
Optional sections: add them only when you track the number
Conversions, backlinks, technical health, competitors, and AI visibility sit on most competing templates. Search Console has no conversion or competitor data, but its Links report covers backlinks and reports such as Core Web Vitals and Page indexing cover technical health. If you already track them, include them. If not, skip.
| Section | Add it when | Where the number comes from |
|---|---|---|
| Conversions or revenue | The reader judges SEO by business results | An analytics tool or the CRM |
| Backlinks | You run link building | A backlink index |
| Technical health | Something broke or changed in the month | A crawler, your log files, or Search Console's Page indexing report |
| Competitors | The reader asks how you compare | A rank or visibility tool |
| AI visibility | You track it | A separate tracker |
One line or one small table per optional section, no more. Report ballooning past three pages? Move the optional sections to an appendix. A report that opens with pages of charts buries its own summary.
Resist a stat about AI Overview share or AI search growth without a source you can show. Round numbers in that space get copied with no verification, and your report does not need to join the chain.
Building and sending the report each month
Run through five steps and the template stops being a one-off.
- Pull last month's data once Search Console has caught up. Search Console has a short reporting lag, so wait a few days into the new month before pulling the final numbers.7
- Use the same metrics as last month for sections 2 to 5.
- Section 5 comes from your change log. What shipped, when, which page.
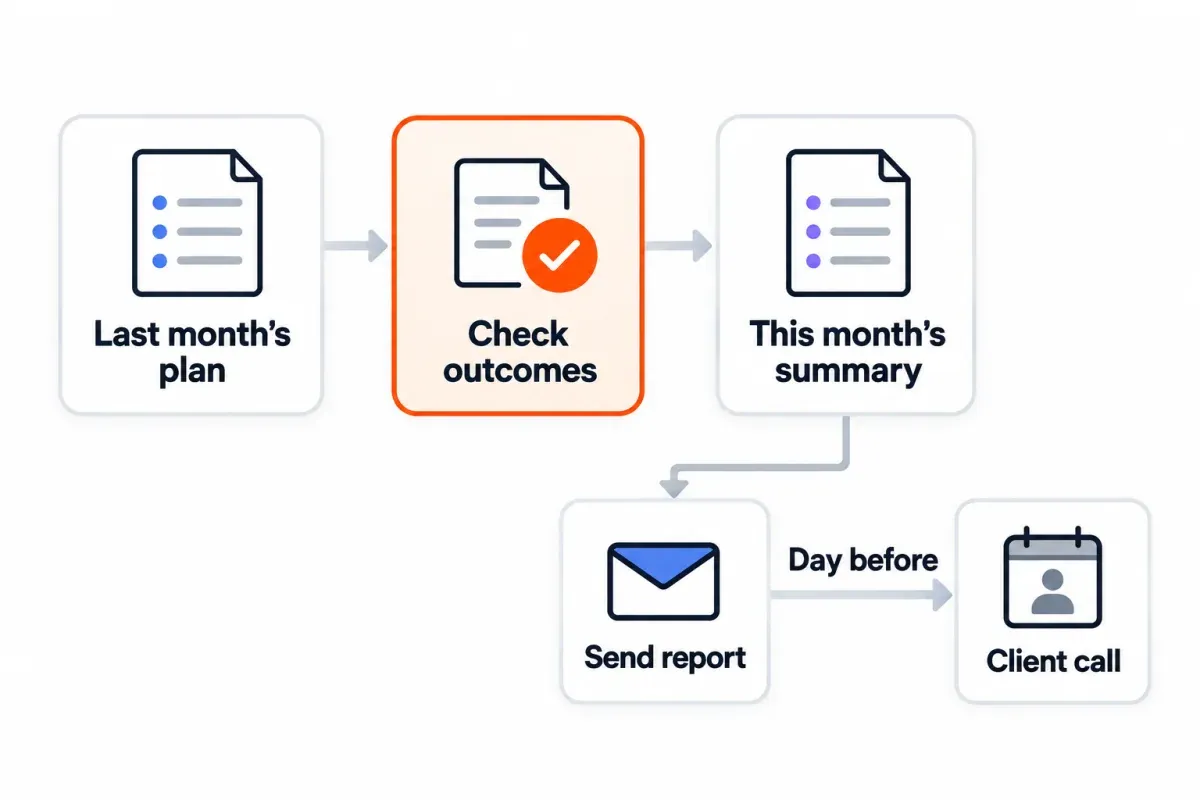
- Write section 1 last, with last month's section 6 in front of you.
- Read it through once as the person getting it. Anything that doesn't help them decide, cut it.
Send it in the first week of the following month, same shape every time. Boss or client getting it? If there's a call, send it the day before so they have time to read. Have last month's version open while you write this one. The comparison columns in section 2 need it, and so does the 'did last month's actions work' line in section 1.
Letting an AI assistant draft the summary? Hand it only the numbers and the page list from sections 2 to 4. Then check every figure against the source before you send. Our guides on Claude for SEO and ChatGPT SEO prompts cover prompts that run on your own data. Need to pull data past the Search Console interface's 1,000-row export cap?4 Our bulk export walkthrough shows you how.
A report is monthly. A dashboard is the live view you glance at between reports. Different job entirely.
Next steps
If the slow part of your monthly report is working out which pages moved, SEO Heatmap shows each page's clicks by month from your Search Console data, with growing and falling filters that produce the gainers and losers for section 3 on their own. It is free for one property.
Frequently asked questions
What belongs in a monthly SEO report?
Six sections cover it. Lead with a summary. Then a core-numbers table, pages that moved, queries, the site changes you shipped that month, and next month's plan at the end. Conversions, backlinks, technical health, competitors, AI visibility? Those are optional sections, and worth adding only if a tool is already tracking them. Search Console has no conversion or competitor data. Do sections 2 through 5 first. Write the summary last. Three items in the plan, no more.
Is Google Search Console enough for a monthly SEO report?
Yes, for the data sections. Clicks, impressions, average position, pages, queries, all of it comes out of the Performance report. The Difference column compares last month or the same month a year back. The change log and the plan are still on you. Search Console has no conversion or competitor data, but its Links report covers backlinks and reports such as Core Web Vitals and Page indexing cover technical health. Push those into optional sections, and only if another tool is already feeding you the figures.
What should the summary of a monthly SEO report say?
Three sentences, saved for last: what changed, what caused it, and what you'll do next. Here's the shape: 'Organic clicks [rose/fell] [X]% to [N] versus [last month], and [Y]% versus [same month last year]. Most of the change came from [page or query group], after [a change we shipped / a seasonal pattern / a cause we have not confirmed]. Close with 'Next month we'll [action 1], [action 2] and [action 3].' Bad news? Say what's confirmed and what isn't, then what you're doing about it.
How do you tell branded traffic apart from non-branded?
In the Performance report's Query filter, look for a Branded or Non-branded option. Use it when it's there. Not available for your property? Google calls out sub-properties and sites with few impressions. No luck? In the Query filter, pick 'Doesn't match regex' and feed it a pattern covering your brand name plus the common misspellings. Pull the top five non-branded queries, with clicks and average position for each. Put the non-branded number up front.
How do you compare month over month in Search Console?
In the Performance report, add a Date filter and hit Compare to pit this month against the one before. A Difference column shows up, lining the two periods against each other row by row. For the same month a year ago, pick a custom date range twelve months back. Search Console keeps up to 16 months of data, so last year's comparison is available when your property has enough collected history.
What should I cut from a monthly SEO report?
Cut sitewide average position (it averages the topmost position across impressions, and can shift when the mix of queries changes). Cut sitewide CTR (it can fall when extra impressions bring few clicks). Drop total keywords counted (meaningless alone). And cut any number you won't act on, or that doesn't move month to month. Pick your metrics and don't change them. The report earns its value when you can read it side by side with last month's, in the same order.
How long should a monthly SEO report be?
One to three pages is a reasonable target (rule of thumb, not a standard). That's six core sections, three plan items, and one line or small table per optional section. Past three pages? Push the optional sections into an appendix. The summary needs to stay on the first screen. Most readers of a monthly report act on only a few things. Shape the document around that.
Building this report every month? SEO Heatmap stacks your Search Console clicks into one grid, page by month, so you open the pages-that-moved section with a picture instead of a spreadsheet sort. Free for one property.
Sources (7)
SEO Heatmap Knowledge relies on primary sources: Google's documentation, web standards, peer-reviewed research, and vendors' own pages for their pricing and features. Our editorial standards
- Google Search Console Help. “Performance report (Search results): Advanced filtering and comparison.”
- Google Search Central. “Debug Google Search Traffic Drops.”
- Google Search Console Help. “What are impressions, position, and clicks?”
- Google Search Central. “A deep dive into Search Console performance data filtering and limits.”
- Google Search Console Help. “Performance report (Search results): Common tasks and use cases.”
- Google Search Central. “Search Console regex filters update and quick tips.”
- Google Search Console API. “Getting your performance data.”