Summarize this article with AI
You open the dashboard on Monday with one question: which pages gained or lost search traffic last week? Plenty of SEO dashboards bury that answer under widgets from five different tools. And by Thursday nobody opens the tab. If you already use Search Console, you have the data to build a version that doesn't go stale.
This guide shows what belongs on an SEO dashboard built on Search Console data alone, and what doesn't. You'll get a table of what that data can and can't supply, a metric-to-action table for the four numbers it gives you, a way to read page-level clicks by month, and two free ways to build it. You'll also see when building isn't worth the trouble. Here's the first decision.
What a free SEO dashboard built on Search Console can and can't show
An SEO dashboard? One screen, that's it. On it sit a few numbers that answer one thing: is organic search growing or shrinking, and where (which pages, which queries). Search Console's Performance data gives you four of those numbers. Clicks, impressions, CTR, average position.1 The slicing options: query, page, date, country, device, search appearance.2 That covers more ground than you'd think at first glance. It also skips a few questions only other tools can answer. The table sorts them.
| Question the dashboard answers | Metric or view | From Search Console's Performance data? | If not, what supplies it |
|---|---|---|---|
| Which pages gained or lost clicks over the last period | Page by clicks, with change | Yes | n/a |
| Which queries are growing or shrinking | Query by clicks and impressions, with change | Yes | n/a |
| Which pages sit just off page one | Page by average position (roughly 11 to 20) with impressions | Yes | n/a |
| Which pages get impressions but few clicks | Page by impressions and CTR | Yes | n/a |
| How clicks split by country or device | Page or query by country or device | Yes | n/a |
| Organic sessions, bounce rate, session time, conversions | Session and event data | No | Analytics (GA4 or another tool) |
| Backlinks and domain authority | Link counts, DR or DA | No | A backlink index (Ahrefs, Moz, Majestic) |
| Crawl errors, redirects, indexation | Crawl and index status | No | A crawler or your server logs (Search Console's Page indexing report is a separate screen, not Performance data) |
| Core Web Vitals field data | LCP, INP, CLS | No | Search Console's Core Web Vitals report on its own, or Chrome UX Report data |
| Rankings for queries you never appeared for | Rank for terms with zero impressions | No | A rank tracker |
Some dashboards lead with bounce rate and session time. Other guides tell you to drop both. On a Search Console dashboard the debate is moot. Neither metric lives in that data. Need them for a specific call? Spin up a side view on analytics and keep the main one clean.
Five or six rows. Pick them now. Next to each, write the move it would prompt. A row that wouldn't change anything you'd do this week or month? Drop it.
The four Search Console metrics, and your move when each one shifts
Clicks move for one set of reasons. Impressions, CTR and average position each have their own. The table turns the four into decisions. The thresholds in it are rules of thumb, not Google's definitions, and "roughly 11 to 20" is a working line for "just off page one," not a Google term.
| Pattern on the dashboard | What it usually means | What to check next |
|---|---|---|
| Impressions up, clicks flat | A snippet or title problem, or impressions on queries you don't want | Pull the queries driving the new impressions and read the title and meta description against them |
| Average position roughly 11 to 20 with impressions rising | The "striking distance" case: the page is close to page one and gaining attention | Strengthen the page's main section, add internal links from related posts, refresh thin parts |
| Clicks down, position steady | Often a SERP change (a new AI Overview, a richer competitor result) rather than a ranking loss | Search the query yourself and look at what now sits above you |
| Impressions and clicks both down | Lost demand (seasonal dips included) or lost rankings | Compare the same weeks a year ago, within the 16-month window, then sort queries by change in clicks: a few big losers point at rankings, a thin loss across many queries points at demand |
Two things to carry into every read of these metrics.
CTR is just clicks over impressions, nothing more.1 It falls when impressions rise on queries you never wanted, with no change in the page's actual performance. A fading CTR with rising impressions is not always bad news.
Average position averages the topmost position your site held across queries. Read it per page or per query. At the whole-site level it's noise. A single new long-tail impression can nudge the number while nothing actually ranked differently.
The biggest click loser is where you start, page or query. Guess first. Write that guess down. Then go look.
Page-level clicks by month: the view that shows which page moved
A single trend line for total clicks can look dead flat while one page is quietly climbing and another is dying. The line hides both. Drop the line. Build a grid instead, with pages down the side and months along the top, each cell shaded by its click count. Now the climber and the fader sit side by side in one view.
To build the grid yourself, export pages by month from Search Console (our bulk export guide walks through getting the data out past the row cap) and apply a color scale in Google Sheets or Excel. SEO Heatmap draws this grid for you from Search Console. It is free for one property and shows each page's clicks by month (16 months) or by week (16 weeks).
The grid shows clicks and nothing else. For impressions and average position per query, check SEO Heatmap's Keywords tab. CTR? That's in Search Console's Performance report, since it's just clicks over impressions.
Reading a page-by-month grid
A grid pays off when you can read the shading. Four row shapes come up often, plus one pattern that isn't a page problem at all. Darker shading is more clicks, in every case.
| Row looks like | Likely story | What to do |
|---|---|---|
| Pale at first, then steadily stronger over several months | A new page that is ranking in | Leave it alone this month; look at the queries it is picking up before you touch the copy |
| The same months light up each year | Seasonal demand, not performance | Compare year over year within the 16-month window before reacting |
| Strong for months, fading in the last few | Decay candidate | Pull the queries it is losing, read the SERP, decide between refresh and rewrite |
| Flat and pale across the whole row | Low interest or wrong intent match | Decide whether the page deserves effort at all before touching the content |
| One sharp drop across many rows in the same month | Sitewide: a core update, a template or tracking change, an indexing problem | Stop looking at pages; look at the change log for that month |
The window stretches 16 months, so year-on-year checks go roughly four months deep. That's as far as seasonality reads. For anything older, you need history you kept yourself.
A sitewide dip in one column usually isn't a per-page story. Catch yourself drafting fixes for 30 pages that all fell the same week? Stop. Look at what changed on the site that week instead.
The weekly shortlist: growing and falling pages
For a weekly check, skip the full grid. Just stack the last full week against the one before. Sort pages by click delta. Take the top three gainers and the bottom three fallers. One line per page is plenty. Then move on. A short routine you actually run beats a thorough one you skip.
In a sheet, that's one sorted column of differences. SEO Heatmap gives you the same list through its URL and growing/falling filters, no sheet needed. The AI insights surface the top gainers and losers automatically.
Page moved? Hit the Keywords tab (or Looker Studio's query dimension) and read which queries gained or lost clicks. Group them first. The decisions come after. Our Google Search Console regex guide has patterns for pulling out question queries, brand versus non-brand queries and URL sections.
Build the dashboard in Looker Studio
Looker Studio (previously Google Data Studio) ships with a free Search Console connector. So it's the obvious pick when someone outside the SEO team needs to open the report.
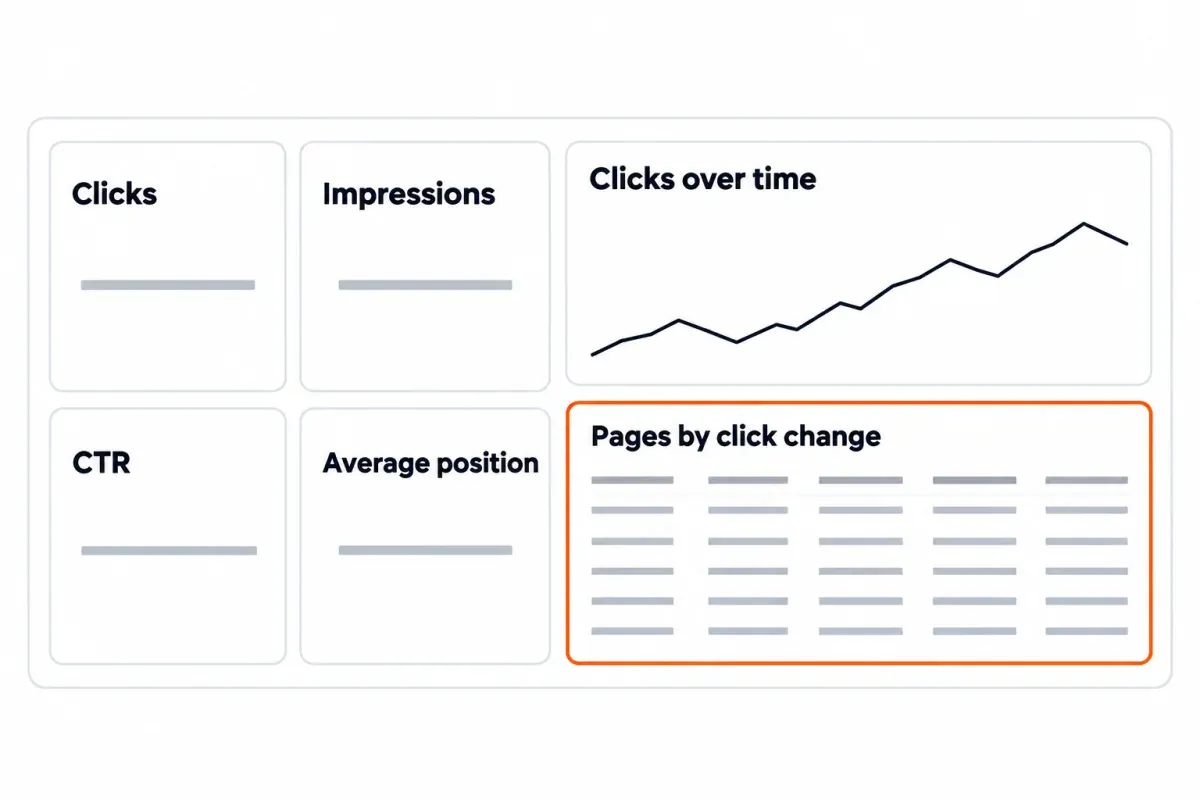
Hook up the Search Console connector. Pick your property. Then the first real decision: one table per data source, either Site Impression or URL Impression. Google's connector docs say a single data source uses just one of the two.3 So the choice is per data source, not per report. Doing anything per-page? Pick URL Impression. The grid, the gainers and losers, the pages hanging just off page one, all of it. That's the table that carries page URLs.
Connector hooked up? Then drop in widgets, one for each row you held onto in the can/can't table:
- Scorecards for clicks, impressions, CTR and average position, prior-period comparison on.
- Time series: clicks and impressions. Choose weekly or monthly, whichever your eye picks up faster.
- Table of pages sorted by click change. Put impressions and position in neighboring columns.
- A table of queries with the same columns.
- A country or device breakdown when the audience answers a question that matters to you.
Expect two surprises. Google's connector page notes that rarely shown queries are rolled into a single row with a blank value for user privacy.3 Add a filter on the Query dimension to drop the blank row, and know that your totals will then not match Search Console's own screens. The second surprise is freshness. Google's data freshness page says the Search Console connector refreshes every 12 hours and that cannot be changed, so "live" means twice a day.4 Your window stops at 16 months of history.
Before you share the link, run through this:
- The right property is connected.
- The table matches the widget (URL Impression for anything by page).
- Date range set to a readable window. Last 28 days with a prior-period comparison is a sensible default.
- The blank-query filter is on where you need totals to behave.
- Every chart carries a title you'd understand cold, and the type (scorecard, time series, table) matches what you're actually asking.
- You've blocked out a weekly review slot. It needs an owner. It goes stale fast.
The question in front of you picks the table. Not habit.
Build the dashboard in a spreadsheet
A spreadsheet is the other free path. It's also the one that gets you the page-by-month grid without a BI tool. The tradeoff lives in the row cap and the maintenance.
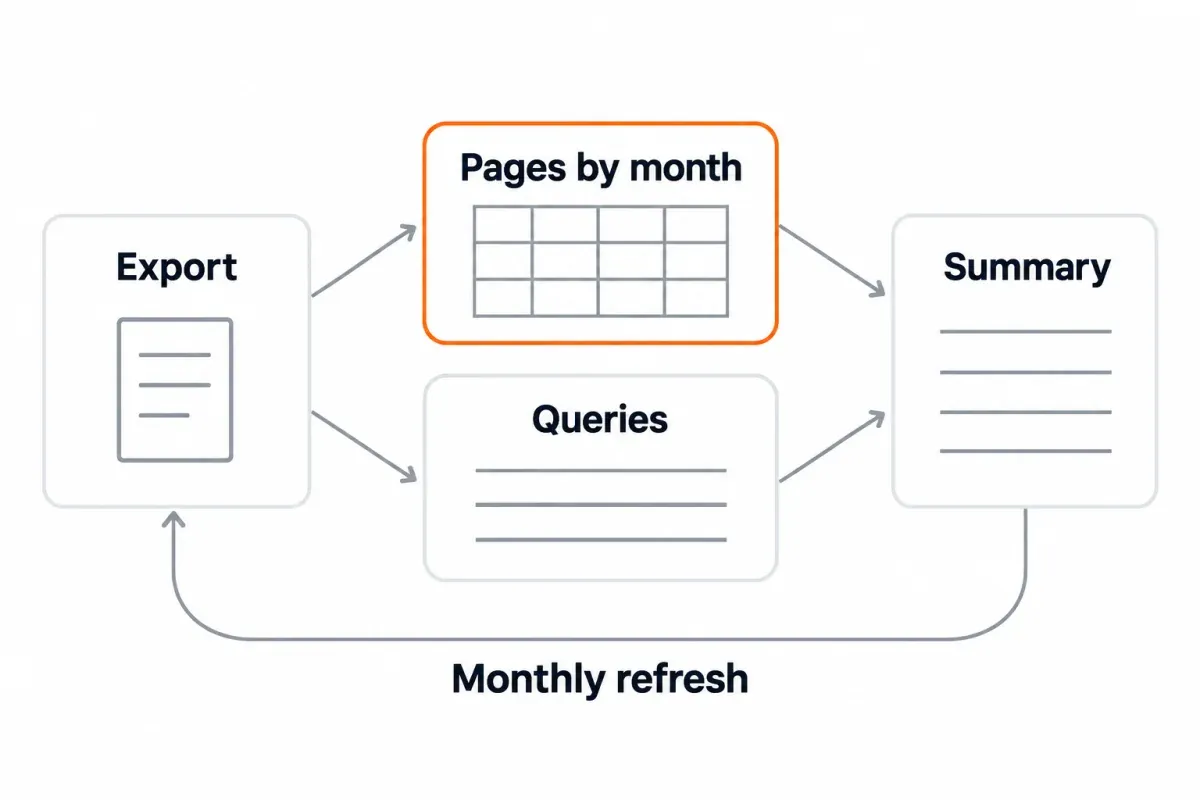
Get the data out first. The Search Analytics API hands you 1,000 rows per request by default.5 Bump that to 25,000. Then page through anything over with a start row. Go through the Search Console UI instead and the cap stays at 1,000 rows. On a site with real traffic? Page through the API, or pick a different export route. Our bulk export guide covers the API's limits, the Sheets extensions and BigQuery.
One sheet per view. Set up a pages-by-month sheet for the grid. Pages as rows, months as columns, a conditional color scale over the lot. Clone the layout for a queries sheet. That's your query-level view. Add a summary tab, four metrics with a line each. That's what you open first every week.
For history past 16 months, append a monthly snapshot to its own sheet from the day you start. That is one way to keep more than the window Search Console gives you. A bulk export to BigQuery builds history too, but only from the day you turn it on, and it doesn't backfill.6 The bulk export guide covers the setup.
Name the tradeoff out loud before you start. Spreadsheets don't refresh themselves. Freshness here is whoever ran the last export. Lock the layout on day one. After that, you only change the date range, so the monthly refresh stays a short job.
Looker Studio, a spreadsheet, or SEO Heatmap: three routes
Need a custom layout, or a report other people will log into? Build it. After the page-by-month view and a list of what moved, nothing more? Skip the build. Below, the three options side by side on what a dashboard owner cares about.
| Route | Setup effort | Strong at | Limits |
|---|---|---|---|
| Looker Studio | Moderate: connect the source, then build and format the charts yourself | Custom charts, a shared link for clients or a team, country and device cuts | Refresh is every 12 hours, you own the maintenance |
| Spreadsheet | Moderate: export, paste and format on every refresh | Full control, and your own history past the 16-month window | Manual refresh, row caps on the export |
| SEO Heatmap | Connect your Search Console property | Page clicks by month (16 months) or by week (16 weeks), a Keywords tab with clicks, impressions and average position per query, URL and growing/falling filters, AI insights on top gainers and losers, Sheets or Excel export without the 1,000-row cap, Claude and ChatGPT through MCP | Free for one Search Console property, paid plans for more; holds the same 16 months Search Console does |
A one-line verdict for each. Looker Studio wins when a client or an exec needs to log into the report. A spreadsheet is right when you want history beyond the 16-month window, kept your way. If the question you keep coming back to is which pages are moving, and you don't want to build anything, SEO Heatmap handles it.
Other tools built on the same data? Our Google Search Console alternatives guide covers them. Prefer asking a chat assistant a dashboard-level question instead of opening a report? Our Google Search Console MCP guide picks up from there.
Using the dashboard: write the expectation first, keep a control group, review on a schedule
A dashboard nobody decides from is wallpaper. What turns glance-at into act-on? Three habits.
Write the expectation first. Before you change a page, write one line: which metric you expect to move, by roughly when, and by how much. "I expect clicks on this page to recover to July's level by late October" is a working expectation. "Clicks go up" is not. Then you check the dashboard against that note, not against a gut feel.
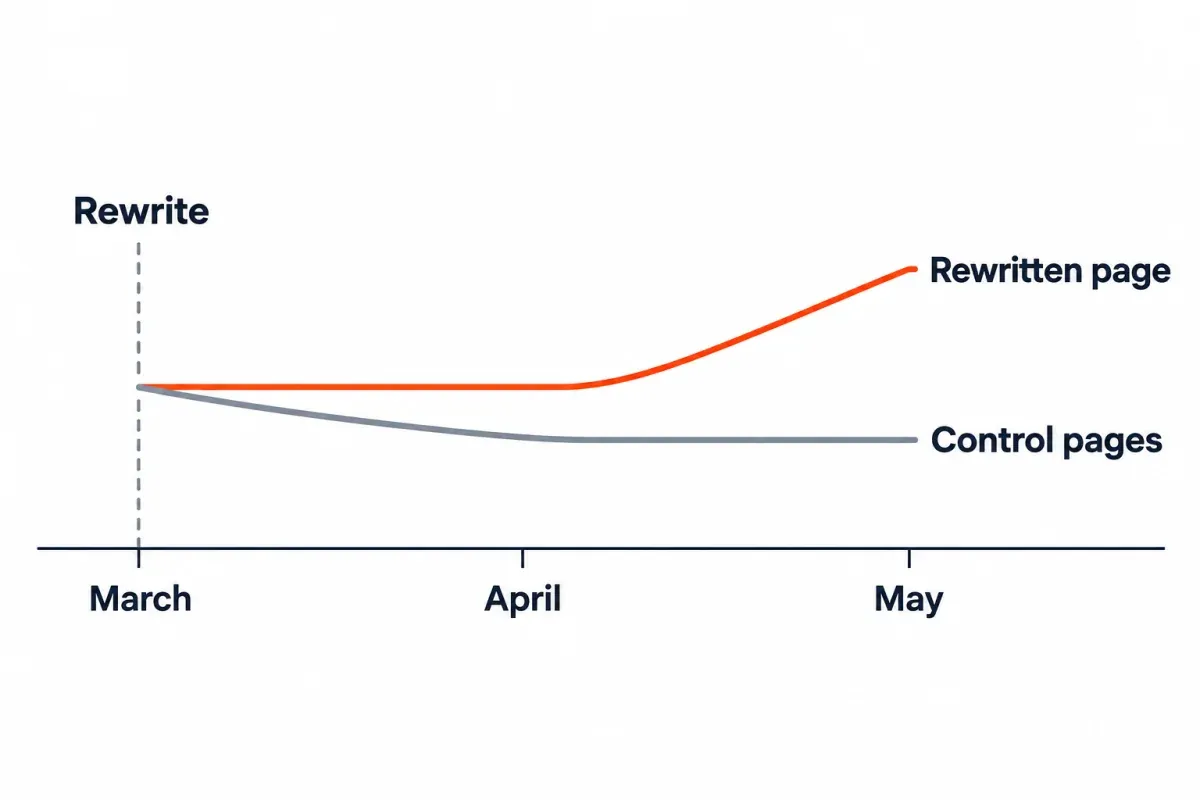
Hold a control group aside. Set aside two or three untouched pages in the same cluster. Hold those alongside the page you changed. A core update, a template tweak, a demand swing: anything site-wide moves the controls as well. Rewritten page climbs while the controls stay put? Odds are the rewrite did it.
Review on a schedule the data can actually serve. With a 12-hour refresh plus Search Console's reporting lag on top, daily reads are mostly noise. Weekly works for shortlists and sharp drops. Monthly handles trends, decay patterns and content calls. Annotate each site change on the dashboard (a note column, a chart annotation). The next person reading the grid will see why that row jumped in March.
A worked example in words. You rewrite a page in March that had been fading for three months. Three comparable pages from that cluster stay untouched as your controls. In April, you expect the rewritten page's clicks to stabilize and the controls to keep drifting. Come May, you want the rewritten page climbing while the controls stay flat or keep slipping. If both the rewrite and the controls climb at the same time? The rewrite probably isn't what moved it. Figure out what did before you repeat the move.
Build the routine once. Calendar invite, repeating weekly.
Next steps
Want the page-by-month view and the growing-and-falling pages without building a dashboard first? One Search Console property is free on SEO Heatmap. Connect your property. Open the weekly view. See which pages moved this week.
Frequently asked questions
What's an SEO dashboard?
One view, a few numbers, one answer: is organic search up or down, and where (which pages, which queries)? That's what an SEO dashboard is. Built on Search Console alone, it carries four metrics: clicks, impressions, CTR and average position. You can cut each by query, page, date, country, device or search appearance. What about bounce rate, sessions, backlinks, crawl errors? Those live in another tool. If a decision needs them, spin up a second view.
Can you build an SEO dashboard using only Search Console?
Yes, for most of the questions that matter. You see pages gaining or losing clicks, queries climbing, pages stuck just off page one, pages pulling impressions but few clicks, and the country or device breakdown. Missing from this picture: session metrics (bounce rate, time on page, conversions), backlinks and domain authority, and rankings for queries you never appeared for. Save them for a side view, opened only when a decision actually needs them.
Does a free SEO dashboard exist?
Yes, and you have three routes. Looker Studio's Search Console connector and a spreadsheet fed by an export are both free to set up. SEO Heatmap is free for one Search Console property. You see each page's clicks across 16 months, or across 16 weeks. Clicks, impressions and average position per query sit in the Keywords tab.
How often will a Search Console dashboard refresh?
Google's data freshness page says the Search Console connector in Looker Studio refreshes every 12 hours, and that cannot be changed. "Live" for this data source means twice a day. Spreadsheets refresh when someone pulls a new export. On top of that, Search Console's own data has a reporting lag. Daily checking mostly shows noise. Realistically, check weekly if you want a shortlist, monthly if you're reading trends.
What makes dashboard totals miss Search Console's?
Usually it's Google's privacy filter. Rarely shown queries get bundled into one row with a blank value. In Looker Studio, you can drop that row with a filter on the Query dimension. After that, the connector's totals come in below what Search Console shows. That's expected. Gap bigger than that? Check the date range first, then the property you connected, then whether the underlying table is Site Impression or URL Impression.
Looker Studio or a spreadsheet, which should I pick?
Pick Looker Studio for a shared report a client or exec can log into. Also for custom charts that Sheets won't easily draw. Choose a spreadsheet if you want history past Search Console's 16-month window kept your own way, or the pages-by-month grid without touching a BI tool. Neither costs anything. The real questions are who else opens it, and how deep your history needs to go.
Can you trust average position on a dashboard?
Only when you read it per page or per query. It averages the topmost position your site held across queries. At the sitewide level, one new long-tail query picking up impressions can nudge the number without a single real ranking shifting. Read it alongside impressions. Useful for finding pages hovering around 11 to 20, just off page one.
Curious which of your pages are growing or fading before you build anything? SEO Heatmap shows each page's Search Console clicks by month or by week. Free for one property.
Sources (6)
SEO Heatmap Knowledge relies on primary sources: Google's documentation, web standards, peer-reviewed research, and vendors' own pages for their pricing and features. Our editorial standards
- Google Search Console Help. “What are impressions, position, and clicks?”
- Google Search Console Help. “Performance report (Search results): Overview and basic setup.”
- Google Looker Studio Help. “Connect to Search Console.”
- Google Looker Studio Help. “Manage data freshness.”
- Google Search Central. “Search Analytics: query.”
- Google Search Console Help. “Start a new bulk data export.”