Summarize this article with AI
Most "SEO KPIs" lists read like a tool catalog: rankings, CTR, impressions, bounce rate, backlinks, Core Web Vitals, Domain Rating, a conversion number if you're lucky. Across the five pages ranking for the phrase this month, we counted 64 line items. Thirteen are a business outcome you can answer for. Everything else? Diagnostics (why things moved) or inputs (work done), dressed up as goals your boss will later ask you to defend.
You'll get a shorter list of SEO KPIs here, with the diagnostics parked under each one. One lagging outcome up top. Below it, two or three leading indicators. The diagnostics? They're there too, ready for when a KPI slips. Also inside: the formulas, a sorting table, and a KPI card you fill in for each one. Targets come from your own Search Console history, not a vendor's benchmark. Missed a number? Trace it back through Search Console, GA4 or into the CRM.
So which SEO KPIs make the cut?
What is a KPI in SEO?
An SEO KPI (key performance indicator) is a single number tying organic search to a business result you're on the hook for, measured against a target you set up front. If it misses, someone has to decide something.
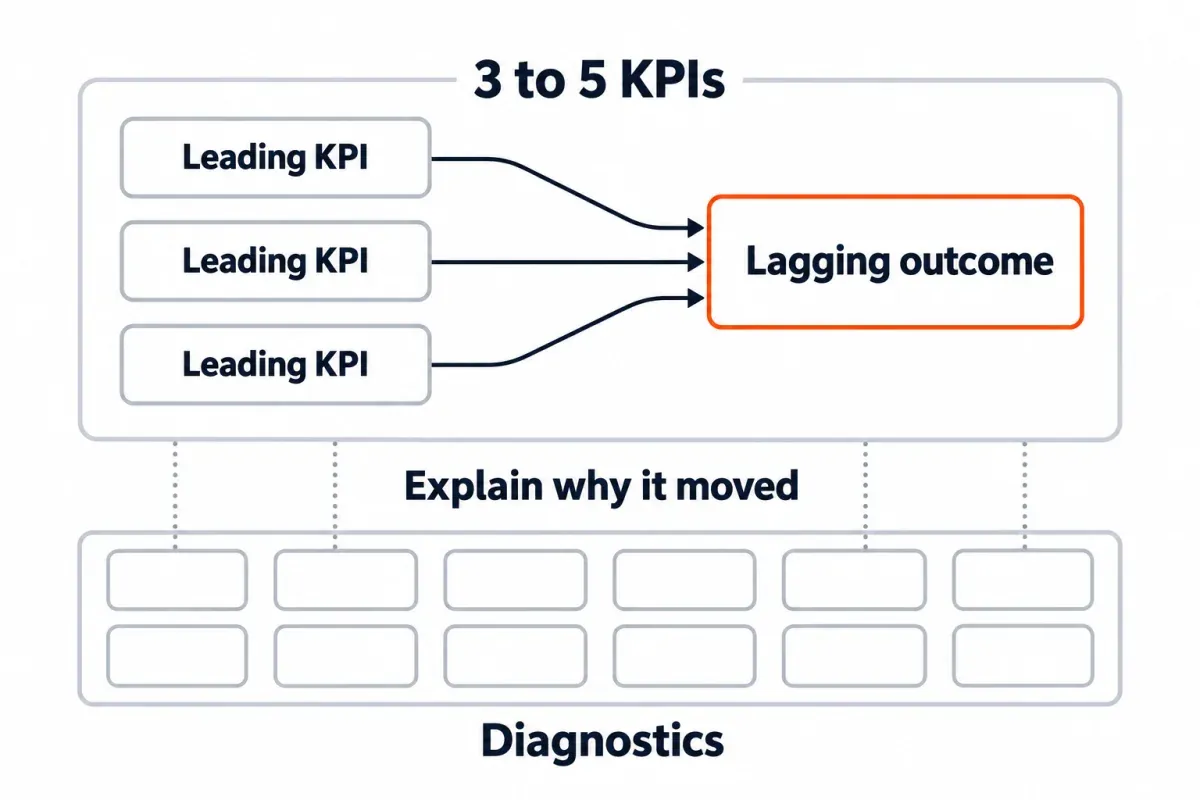
The one-line test. A KPI:
- is tied to a stated business goal,
- has a target and a date,
- has an owner, and
- forces a decision when it misses.
A diagnostic explains why a KPI moved. You check it; you don't report it as a goal.
For edge cases there's a sharper version. Can this number go up while the business result doesn't? If yes, it's a diagnostic. Impressions can rise on queries that never convert. Keyword rankings can climb in search results for a term nobody searches. Both feel like progress and show none.
Why this matters: we counted the items in the five top-ranking guides for "seo kpis" (October 2026). Lengths of 8, 10, 12, then 16 and 18 KPIs. Add them up: 64 items. Thirteen of the 64 actually tie back to a business outcome. That's revenue, conversions, leads, ROI, customer lifetime value, cost per acquisition. Everything else? Diagnostics mostly, plus work logged (new backlinks, on-page fixes) and scores from third-party tools. Some of those guides preach a tight shortlist, then hand you a dozen anyway.
Cap the SEO KPIs at 3 to 5. One lagging outcome (the business result). Two or three leading KPIs that move earlier. That gives you time to react before the quarter closes. Got a dedicated SEO budget line? Tack on an efficiency KPI, cost per acquisition or ROI.
Vocabulary matters here. Every KPI is a metric. Most SEO metrics, though, aren't KPIs. "SEO metrics" is the whole box of numbers you can track and monitor. "SEO KPIs" are the ones you answer for.
SEO KPIs vs diagnostic metrics: sort the usual list into two tiers
Pull the list a boss or tool handed you. Then, before the next planning session, run every item through the table below. Columns: the metric, its tier, the reason, plus either what it explains (diagnostics) or where you'll find it (KPIs).
| Metric | Tier | Why | What it explains / where it's measured |
|---|---|---|---|
| Organic conversions, key events (volume) | KPI | the business result for most sites | GA4 Organic Search, or the CRM |
| Revenue or pipeline from organic | KPI | money, when you can attribute it | GA4 ecommerce reports, CRM |
| SEO ROI, cost per acquisition | KPI (efficiency) | only when SEO has its own budget line | spreadsheet of revenue and costs |
| Non-branded clicks | Leading KPI (the outcome itself for publishers) | the part of search traffic SEO actually earns | Search Console |
| Organic sessions / traffic | Leading KPI for publishers, diagnostic for everyone else | traffic only pays when it converts or is the product | GA4 |
| Conversion rate | Diagnostic | a rate can rise while volume falls | explains conversions |
| Impressions | Diagnostic | counted even when your result isn't scrolled into view | explain clicks (demand and visibility) |
| CTR | Diagnostic | moves with the results page, not just your title | explains clicks at the same impressions |
| Average position, keyword rankings | Diagnostic | an average of your topmost result across queries | explain clicks |
| Engagement rate, average engagement time, bounce rate, time on page | Diagnostic | describe the visit, not the result | explain conversions (did landing visitors engage) |
| Indexed pages, Core Web Vitals | Diagnostic (technical) | a page that isn't indexed or is slow can't earn clicks | explain clicks on the affected pages |
| Backlinks, referring domains | Diagnostic or input | work done; the effect shows up later in rankings | explain rankings |
| Domain Rating, Domain Authority, Authority Score | Vendor score | third-party estimates from Ahrefs, Moz and Semrush, not a Google or analytics number | nothing directly; watch the trend at most |
| AI citations, mentions, share of voice | Diagnostic | sampled from prompt sets by third-party tools | explain AI referral sessions and brand demand |
Two things to state clearly beneath that table.
The KPI is conversion volume. Conversion rate sits under it as a diagnostic. Run the numbers. Take 2% of 5,000 visits. That's 100 conversions. At 0.3% of 50,000, you'd land on 150. The rate fell and the result grew. Report volume, keep the rate as a check.
Branded versus non-branded isn't a metric on its own. It's the split every clicks KPI needs. Brand demand drives branded clicks (ads, PR, word of mouth), so mixing them in hides what SEO actually did. The target goes on non-branded clicks.
A few definitions to state right, since most guides state at least one of them wrong. In Search Console, average position is the average position of the topmost result from your site, not where you rank on any single query. An impression is counted when your link appears on the search engine results page whether or not it's scrolled into view, and Google itself tells sites to aim for meaningful impressions, not more of them. GA4 still reports bounce rate (the share of sessions that weren't engaged) next to engagement rate. GA4 now calls conversions "key events". Core Web Vitals: LCP, INP and CLS. INP took over from FID back in March 2024.1 Keep bounce rate and engagement out of any ranking argument. Both describe the visit, not how the page ranks.
SEO KPI examples by business goal
Pick your row, take the lagging KPI and two or three leading ones, and stop. Everything else is in the diagnostic tier below.
| Site type | Lagging KPI | Leading KPI(s) | Where each is measured |
|---|---|---|---|
| Ecommerce | organic revenue and orders | non-branded clicks to product and category pages; organic add-to-cart or checkout starts, if tracked as key events | GA4 (Organic Search channel, ecommerce reports), Search Console (page filter) |
| B2B lead gen | organic-sourced qualified leads or pipeline value | organic form submissions (GA4 key events); non-branded clicks to service and solution pages | CRM (lead source), GA4, Search Console |
| SaaS, self-serve | organic sign-ups or trial starts, then trials that convert | non-branded clicks to feature, comparison and use-case pages | product analytics or GA4 key events; Search Console |
| Publisher or ad-funded | non-branded clicks or organic sessions (traffic is the product here); revenue per session where you have it | clicks to new articles in their first weeks; impressions on target topics | Search Console, GA4, the ad platform |
| Local business | calls, direction requests and website clicks from the Business Profile; organic form fills or bookings | local-intent non-branded clicks | Google Business Profile performance, GA4, Search Console |
If AI referrals matter to you, grab one more KPI from the AI section below: sessions and key events from GA4's AI Assistant channel.2
When SEO has its own budget line, tack on cost per acquisition or ROI. Otherwise, three or four is enough.
Formulas for the SEO KPIs you'll actually use
Guides state these inconsistently; here's each formula. Each one gets calculated in the tool it already lives in.
- Non-branded click share: inside Search Console, divide non-branded clicks by total clicks over matching dates, then times 100.
- Organic conversion rate (a diagnostic): in GA4, divide organic key events by organic sessions, then times 100.
- SEO ROI: organic revenue minus the cost of SEO, divided by that cost, times 100.
- Cost per acquisition for SEO: take your full SEO spend and divide by the customers (or leads, pick one) organic brought in
- Customer lifetime value = average purchase value x purchases per year x years as a customer (it feeds the revenue side of ROI; not an SEO KPI on its own)
- Organic share of pipeline: pipeline value from organic-sourced leads, divided by total pipeline, times 100, pulled from the CRM
- Click-through rate (CTR, a diagnostic): clicks over impressions as a percentage, which Search Console works out automatically
One worked line each. Spend $9,000 in a quarter. Pull $16,000 back in organic revenue. ROI shakes out to 77.8%: that's (16,000 minus 9,000) divided by 9,000. Say the spend is $5,000 and organic closes 100 customers. Your CPA lands at $50.
Two gotchas. Define "acquisition" before CPA goes anywhere near a report. In one sentence: is it a lead, a sign-up or a paying customer? Same drill for "cost of SEO". People's time? Agency or freelance fees? Tools and content production? Settle the scope up front. Leave anything out and the ROI will look flattering and lie.
Write a KPI card for each one
Write the KPI down first. The target comes after. One block per KPI on the card below. It turns alignment with a boss or client into a filled-in form instead of an argument about which number counts.
KPI: [name]
Business goal it serves: [goal]
Formula: [formula]
Source: [Search Console / GA4 / CRM / Business Profile], [report, filter]
Leading or lagging: [which]
Owner: [person]
Baseline: [value], [date range], [same months last year]
Target: [value] by [date]
Miss threshold: [value below which we act]
Review: [monthly / quarterly]
Diagnostics to check if it misses: [list, in order]
The next section fills Baseline, Target and Miss threshold. The one after fills the diagnostics list.
How to set an SEO KPI target from your own Search Console data
Published benchmarks contradict each other. Few show their method. They also drift the moment Google changes the results page. Your own year-over-year numbers already account for niche, brand strength and the seasonality your category sees. That's your target source.
Here's the procedure.
- Grab the baseline month by month. Pull up Performance in Search Console and stretch the date range across all 16 months. Switch the chart's granularity to Monthly (the dropdown also offers Hourly, Daily and Weekly).3 That's 16 months: a full year plus the four leading up to it.
- Compare the same months last year. Not last month. Seasonality cancels out. A December dip or a January peak isn't a trend.
- Split branded from non-branded before you set anything. Search Console added a branded queries filter in November 2025: it's set by an AI-assisted system, only offered on top-level properties with enough queries and impressions, and some queries may be misclassified. On a subfolder or subdomain property, or anywhere the filter doesn't show up, use a regex of your brand name and its common misspellings (our Google Search Console regex cheat sheet has the pattern). The target goes on non-branded; branded gets a watch, not a goal.
- Set the target as the baseline plus the lift your planned work can justify. Not a round number. What are you publishing, fixing or updating this period, and for which queries? Our SEO forecasting guide walks through the projection on your own data.
- Write down the targets, the miss threshold and the review date before the period starts. Leading KPIs? Review monthly. The lagging ones, plus anything link- or ranking-driven, want a full quarter before judgment.
A worked hypothetical, so the math stays visible. Say non-branded clicks hit 9,400 in January to March last year and 10,800 this year. That's roughly 15% up. Last year's April to June pulled 11,200, so the trend alone would land you around 12,900. The team plans to update 12 pages that sit on page two for their main query and expects them to add around 600 clicks over the quarter. Set the target at 13,500 non-branded clicks for April to June. Miss threshold is anything under 12,300, which is about 10% up on last year and short of the trend by itself. Below that number, you open the diagnostic check. The numbers here are illustrative. The method is what matters.
Organic conversions take the same shape in GA4. Organic Search channel, key events, same months last year. Did a key event's definition change mid-year? Baseline from that change forward.
When an SEO KPI misses: which diagnostics to check, in order
Start outside. Work your way in. Confirm the drop is real and that it's actually in search. Then find where it is. Then find why. The three rows below cover most misses.
| KPI that missed | Check first | Then | Then | Usual causes |
|---|---|---|---|---|
| Non-branded clicks | Same months last year (seasonality) | Site-wide or a few pages? | Impressions, CTR and position per page and query | Lost queries, SERP change, ranking slip, indexing issue |
| Organic conversions (clicks held) | Did sessions move with clicks? | Which landing pages lost key events? | Did the key event or form change? | Tag broken, consent banner, mix shift |
| CRM leads (GA4 key events held) | Form-to-CRM sync | Lead qualification rules | Duplicates or spam in GA4 | Sync broken, MQL redefined |
Non-branded clicks dropped
The common one, worked in Search Console.
- Same months last year. If last year dipped the same way, it isn't a miss. Note the seasonal pattern on the KPI card and move on.
- Site-wide or a few pages? Compare the period by page. When a handful of pages account for most of the drop, those pages are the problem. Every page slipped a little? Lean toward demand or something site-wide. A page-by-month heatmap of clicks makes this one glance. Rows are pages, columns are months, color shades the clicks.
- Back in Search Console, line up impressions, CTR and average position for exactly the pages and queries that bled clicks. Impressions down, position unchanged? Demand softened, or you're showing on fewer queries. Flat impressions with a lower CTR? Something on the results page shifted (an AI Overview, more ads, a fresh rich result), or your title or snippet changed. A lower position is a ranking loss on those queries.
- Technical check on the losing pages. Open the Page indexing report and look for pages that dropped out of the index, run URL Inspection on a sample, and check Core Web Vitals for the page group. Our guides on Crawled - Currently Not Indexed and Soft 404 cover two of the statuses you're likely to find there.
- What changed on your side in the window? Think releases, migrations, redirects, template changes, big content edits. A dated change log keeps this step at minutes instead of hours. Then turn outward. What did competitors publish, update, or earn new links to on those queries?
One caveat. Clicks from AI Overviews and AI Mode get bundled into Search Console's Web search type, so you can't isolate how much a CTR change on a given query owes to an AI Overview. Open the results page for your top losing queries and look.
Organic conversions dropped while clicks held
The miss happened after the click. Move to GA4.
- Did organic sessions fall too? Search Console clicks and GA4 sessions never match exactly (our guide on why clicks and sessions don't match explains the reasons).4 Compare each one against itself last year. Not against the other.
- Which landing pages lost key events? Head to the Landing page report, filter down to Organic Search. Line up key events per landing page against the same months last year.
- Did the key event itself change? A renamed event, a broken tag, a new consent banner, a form that moved: check GA4's key event settings and test the form yourself.
- Did the traffic mix change? If informational pages picked up and commercial ones slipped, click totals look flat even as conversions tank. Group URLs by folder or template, then look at clicks by page type against the same months a year back.
CRM leads dropped while GA4 key events held
The miss sits between analytics and the CRM somewhere.
- First stop: the form-to-CRM sync. Does the lead source field still populate for organic? Fire a test lead at it. See where it ends up.
- Did lead qualification change? A fresh MQL definition. A rep reclassifying. A scoring tweak. Any one of them trims the lead count while SEO sits untouched.
- Are duplicates or form spam padding your GA4 key events? A GA4 key event counts an action.5 A CRM lead is one de-duplicated person. GA4 key events up, CRM leads flat? The extras may be duplicates or spam.
Wait, fix or re-target
Three decisions sit at the end of these flows.
- Wait. KPI still above the miss threshold? Or a diagnostic pins the drop to seasonality or a one-off. Add a note to the card. Come back on the review date.
- Fix. A diagnostic surfaced the cause. Pages fell out of the index. A title changed. A form broke. A template got slow. So fix it. Log the date. Then judge the KPI once the review window shuts. For page-level calls (keep, update, merge, remove), run them through the content audit workflow.
- Re-target. Something shifted under the goal, or the business itself did. A product line went away, a market was dropped, lead qualification got rewritten. Rewrite the KPI card. A target that stopped mapping to anything real only generates noise in the report.
AI search KPIs: what Search Console and GA4 can separate
GEO, AEO and "AI search" are new names on top of the same question: which numbers show the AI side of the funnel? The lagging KPI stays put: conversions or revenue. The leading KPIs and diagnostics underneath are what move. Here is what Google's and GA4's own docs say they report.
| Source of the visit | Where it's counted | Can you separate it? |
|---|---|---|
| Clicks from AI Overviews and AI Mode | Search Console Performance, Web search type; GA4 Organic Search | No. They're inside the totals, and Google's docs don't describe a separate AI Overview report. |
| Visits from ChatGPT, Gemini, Copilot and similar assistants | GA4 AI Assistant channel (ChatGPT, Gemini, DeepSeek, Copilot and Grok; excludes AI Overviews and AI Mode) | Yes, as sessions and key events. |
| Citations, mentions, share of voice in AI answers | Third-party tools that sample prompt sets | Only as an estimate from a sample. |
So the rules.
GA4 measures AI Assistant sessions and the key events they produce. For sites where that traffic matters, it works as a leading or lagging KPI. Set them like any GA4 KPI. Baseline from the same months last year, target tied to planned work, miss threshold written on the card.
Citations, mentions, share of voice, vendor AI visibility scores: diagnostic tier, every one of them. They're useful to explain a change in AI referrals or brand demand, but too sampled to be a target.
Two details from Google's docs that quietly change how numbers read. Search Console assigns every link in an AI Overview the same position.6 A page cited there can post a high position with few clicks. And every follow-up in AI Mode counts as a new query. One conversation can stack up several queries and impressions.
Nothing beyond that. Headline figures on how much AI Overviews cut CTR, or how much more an AI visitor is worth, come from vendors' own samples, not from your Search Console or GA4.
Where SEO KPIs live and when you review them
Different tier, different cadence to run on. KPI tracking lives in one place. Pull every KPI from the same report each period. Otherwise, a trend can turn out to be an artifact of which source you opened. Leading KPIs get a monthly review. Lagging KPIs get a quarterly one, against the same quarter last year. Diagnostics only get opened when a KPI crosses its miss threshold, plus a quick weekly monitoring scan of what moved so a drop doesn't sit for a month.
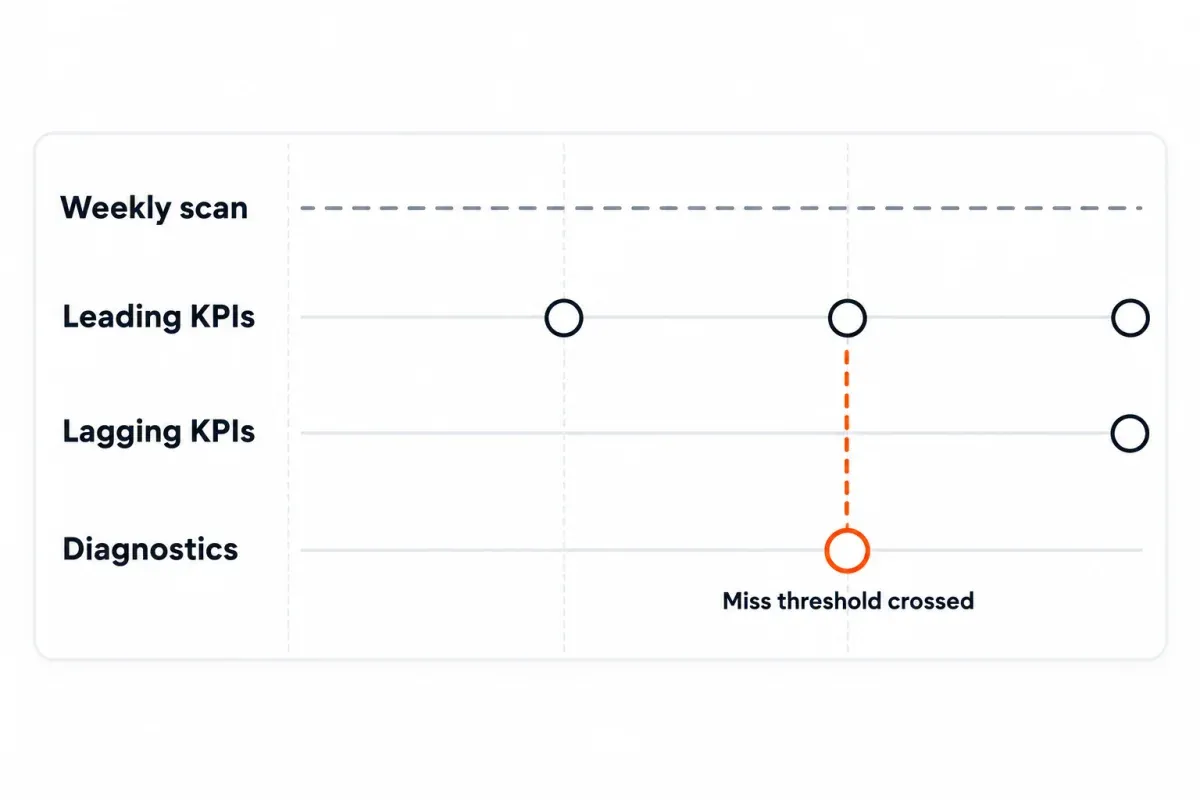
Dashboard top row, monthly report headline numbers: that's where the KPIs sit. Underneath, bucket diagnostics with the KPI they help explain. For the layout itself, our guides on building an SEO dashboard from Search Console data and the monthly SEO report show where every number lives.
One habit worth keeping. Share the KPI cards with your boss or client before the period kicks off, not once it's over. A miss then leads to the agreed check and decision, not an argument about which number was ever the right one.
Next steps
Three moves.
- Take your current list to the two-tier table. Hold the list to 3 to 5.
- Fill a KPI card for each one: baseline from the same months last year, written miss threshold.
- When one misses, run the matching diagnostic flow before you change anything.
When a clicks KPI drops, SEO Heatmap gets you to the pages that moved in one view. The heatmap lays out each page's clicks by month, week or quarter across the same 16 months Search Console covers. Growing and falling filters surface the biggest movers, and the Keywords tab shows clicks or average position per query. It's free for one Search Console property. Impressions and CTR? Still Search Console's Queries table.
Frequently asked questions
What is a KPI for SEO?
An SEO KPI tells you whether organic search is hitting a business result you own, judged against a target set before the period kicks off. Four things are non-negotiable. In writing: a business goal. A date-bound target. An owner. A decision that triggers the moment it misses. What about rankings, CTR, impressions, bounce rate? Those are diagnostics. They explain why a KPI moved. You check it. They aren't the goal itself.
How many SEO KPIs are enough to track?
Aim for 3 to 5. One lagging KPI covers the business outcome itself (organic revenue, qualified leads). Two or three leading KPIs move earlier, giving you room to react before the period closes. Got a dedicated SEO budget? Tack on ROI or cost per acquisition for efficiency. The rest drops into the diagnostic tier, parked under whichever KPI it explains.
Does keyword ranking count as a KPI?
No. Average position is a diagnostic. It can rise on terms nobody searches. It can fall even as non-branded clicks grow. The Search Console number is an average of your top-ranking result across queries, not one single rank. Use it to make sense of swings in non-branded clicks. Not as the target itself.
Is organic traffic a KPI?
Only when traffic is the product. For publishers and ad-funded sites, non-branded clicks or organic sessions make a reasonable KPI. On ecommerce, SaaS and lead gen sites? Organic traffic sits on the leading side. The real KPI is revenue, sign-ups or leads. Clicks can grow without any of those budging.
Should I compare CTR monthly or yearly?
Year over year, by page and query. Not site-wide month to month. CTR moves with the results page itself (an AI Overview, a new rich result, more ads) and with the query mix you show for. A site-wide number compared month to month can end up tracking which queries happened to surface. Pulling the same months from a year ago washes out both seasonality and the query mix.
What are technical SEO KPIs?
Indexed pages? Core Web Vitals? Crawl errors or server response times? These sit on the diagnostic side almost always. Not KPIs. They tell you why clicks dropped on affected pages. A page that isn't indexed, or one that's slow, can't earn clicks in the first place. Park them under your non-branded clicks KPI as checks you run when it misses.
How do GEO or AEO KPIs differ from SEO KPIs?
Your lagging KPI doesn't shift. Still conversions or revenue. Your dashboard's blend of leading KPIs and diagnostics? That part shifts. Visits from ChatGPT, Gemini, Copilot and other such assistants land in GA4's AI Assistant channel. For sites where that traffic actually matters, it can act as a leading or lagging KPI. Clicks from Google's AI Overviews and AI Mode roll up inside Search Console's Web search type and GA4's Organic Search. Google's own tools won't separate them for you.
Agreeing on SEO KPIs is a one-meeting job. Finding which pages moved when one misses can take an afternoon. SEO Heatmap lays out every page's clicks month by month on one screen, so a drop has an address before you open a single report. It's free for one Search Console property.
Sources (6)
SEO Heatmap Knowledge relies on primary sources: Google's documentation, web standards, peer-reviewed research, and vendors' own pages for their pricing and features. Our editorial standards
- Google Chrome team, web.dev. “Interaction to Next Paint is officially a Core Web Vital.”
- Google Analytics Help. “Default channel group.”
- Google Search Console Help. “Performance report (Search results): Overview and basic setup.”
- Google Search Central. “Using Search Console and Google Analytics data for SEO.”
- Google Analytics Help. “Conversions vs. key events in Google Analytics.”
- Google Search Console Help. “What are impressions, position, and clicks?”