

Stop guessing what to do next in SEO
SEO Heatmap turns Google Search Console into a color-coded heatmap of every page, month by month, so you instantly see what's growing, what's slipping, and where your next quick wins are.
- Every page, no 1,000-row limit
- Export to Sheets or Excel
- Works with Claude & ChatGPT
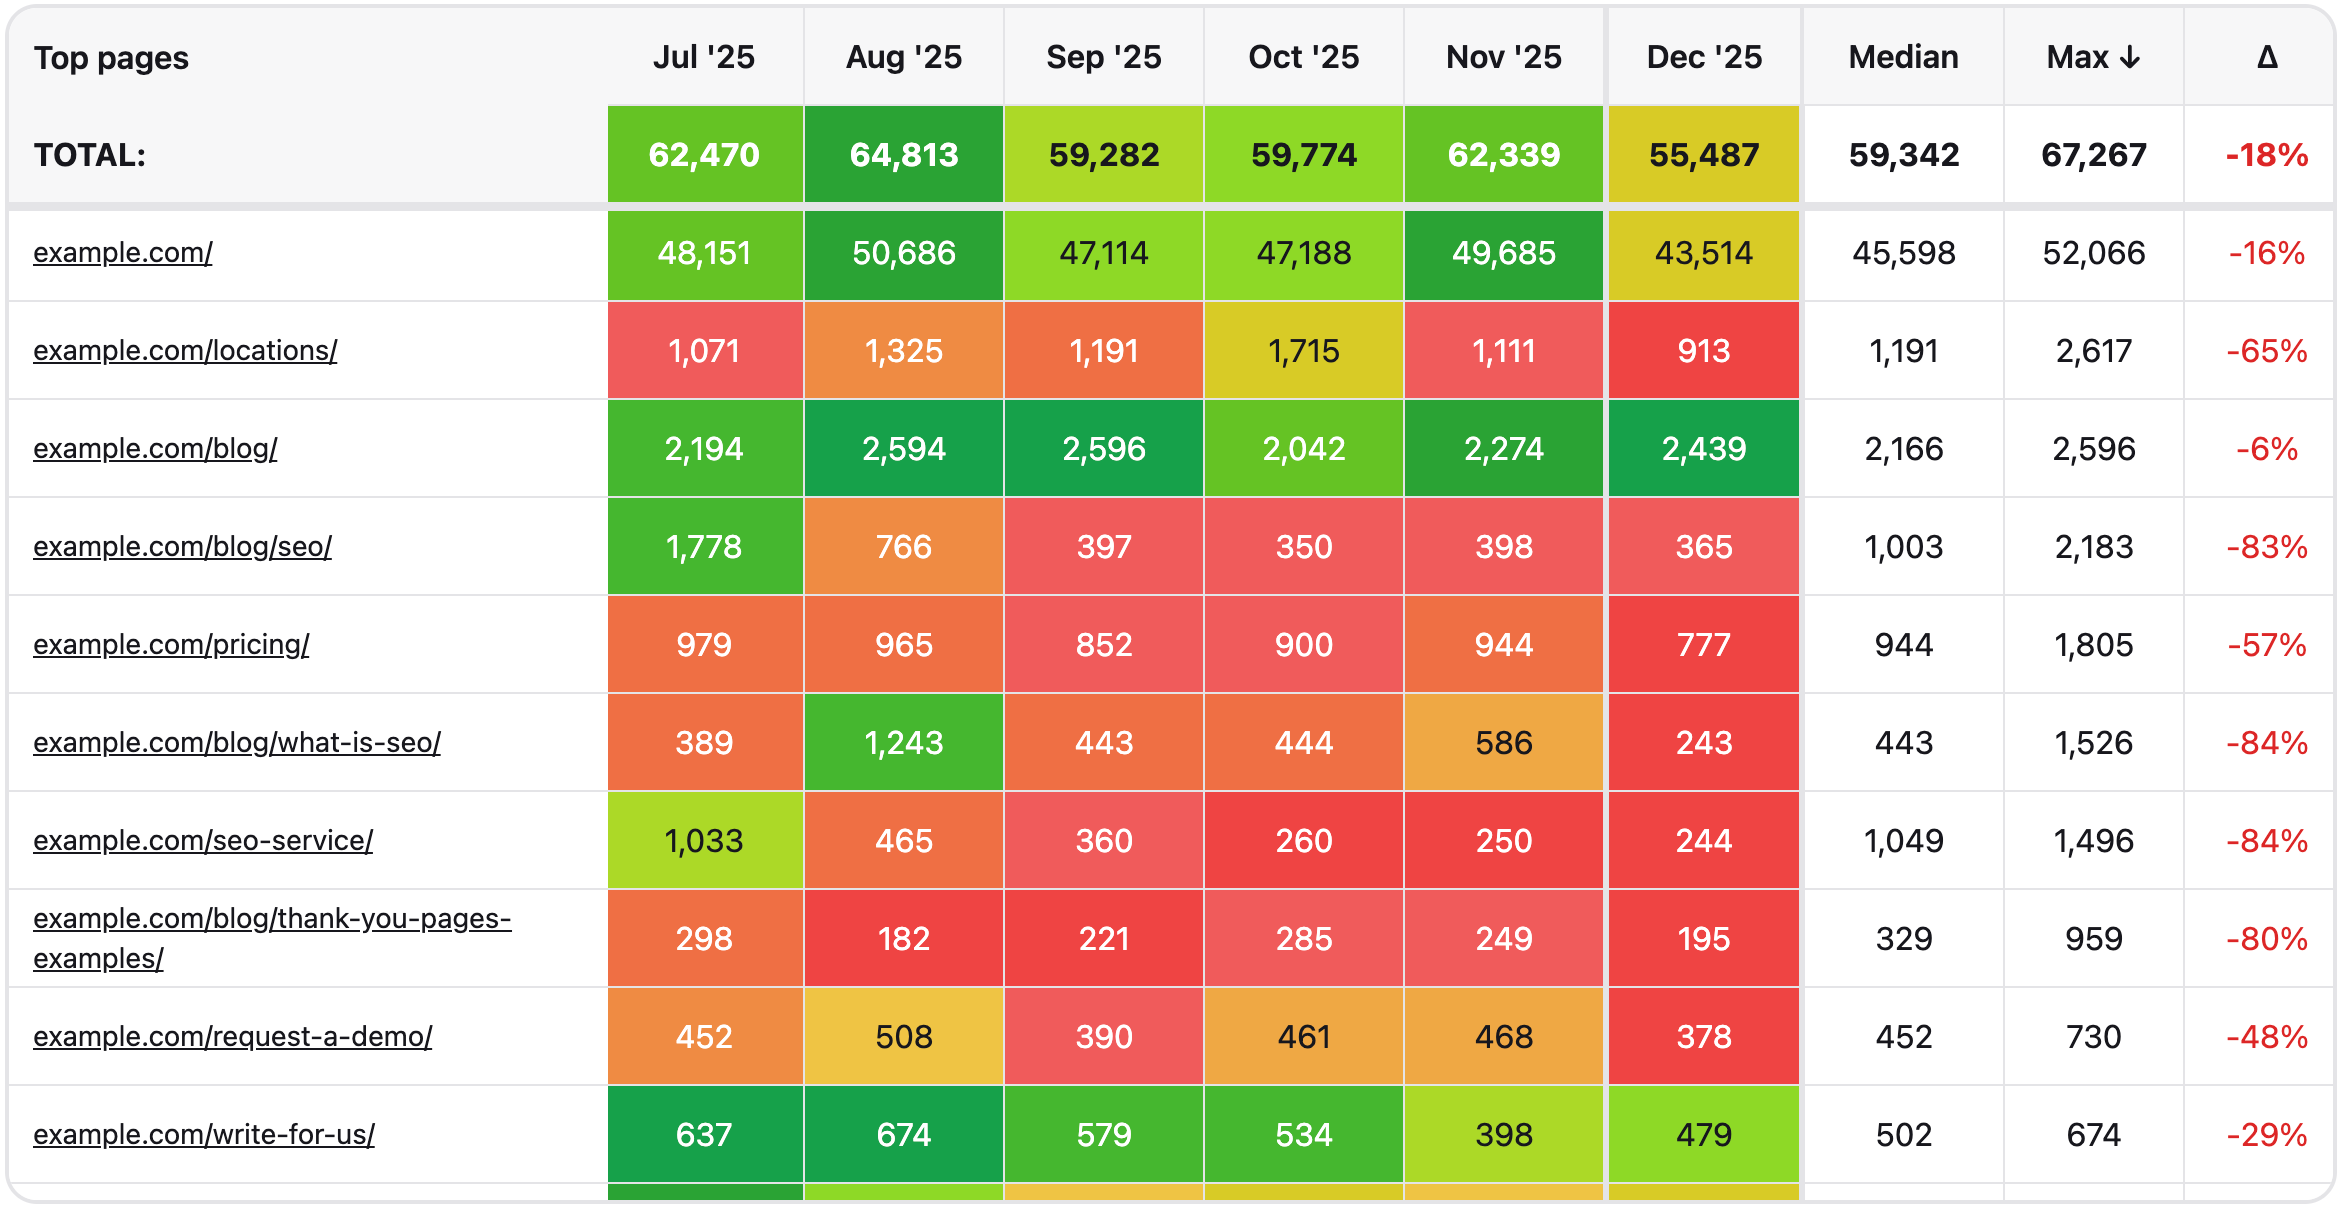

See 16 months of clicks for every page on one screen

Catch slow declines and rising pages before they hit your totals

Leave with a clear weekly backlog: refresh, fix, double down
Free tool. No credit card.
Search Console has the data. Getting answers out of it is the hard part.
Every SEO asks the same three questions:
"Which pages are the fastest wins?"
"What should we refresh next?"
"Which pages are trending up, and which are quietly dropping?"
Answering them usually looks like this:
- Compare 2 date ranges
- Export 1,000 rows
- Pivot in Sheets
- Color-code by hand
- Repeat monthly
When you can't see patterns, you can't prioritize.
Your page performance, color-coded
A free SEO reporting dashboard built on your Search Console data. Each page is a row, each month a column, colored from its own low to its own high, so rising and falling pages jump out without a single formula.
- Compare month over month, year over year, week over week or any two periods
- Filter by URL to focus on one section: include /blog/, exclude /tag/
- Sort by Median, Max or Δ to surface the biggest movers
- Hide the unfinished current month, so pacing never looks like a drop
- “Get insights with AI”: a one-click summary of your top gainers and losers
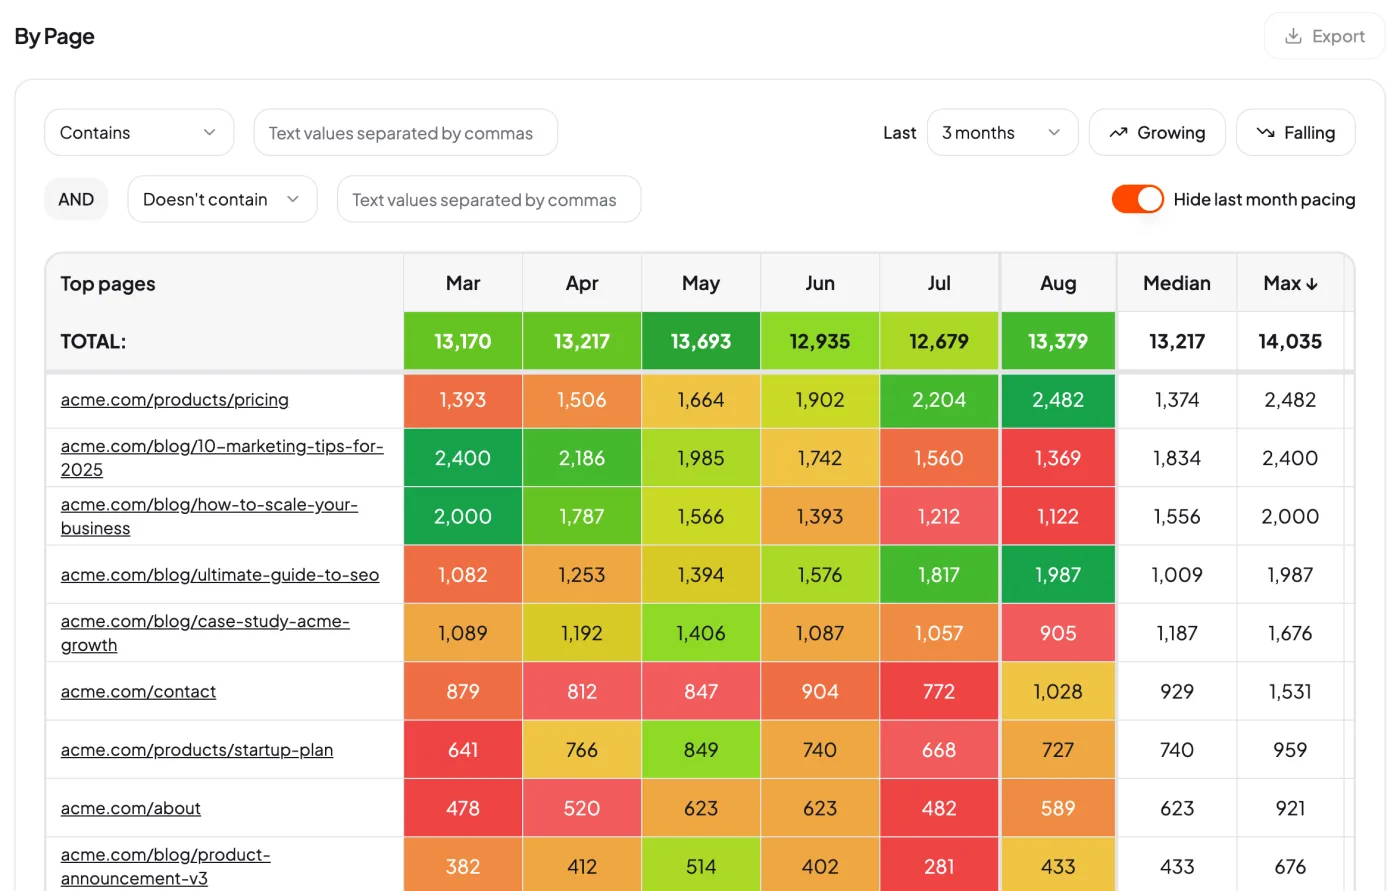
All of your Search Console pages, faster and more complete
Search Console’s reports and exports stop at 1,000 rows. SEO Heatmap pulls every page and keeps it ready, so you work from the full picture, fast.
Every page, not just 1,000
We pull clicks for every URL on your site, long tail included, not just the top 1,000 rows.
Faster, more complete data
Clicks are synced and pre-aggregated per page and period, so views load in seconds and every period is complete.
16 months of page history
Month by month for 16 months, or week by week for 16 weeks. Slow declines and seasonal swings stand out.
Take your Search Console data to your AI agent
Ask Claude or ChatGPT about your clicks and get answers in seconds. Prefer a spreadsheet? Export every page to Google Sheets or Excel.
Your Search Console clicks, in Claude and ChatGPT
Ask a question, get a finished answer: trends, winners, losers and decaying pages. No CSVs, no row limits, no formulas.
- “Which pages have been falling for 3 months in a row?”
- “Give me a refresh shortlist: pages far below their peak.”
Works with Claude, ChatGPT, Claude Code, Codex and Cursor. Read-only, like the rest of SEO Heatmap: the AI can’t change anything in Search Console, and you can disconnect it anytime. Included in every plan.
See how to connectEvery page, exported to Sheets or Excel
Download the whole heatmap in one click: every page and every period, with the heatmap colors. The file opens in Excel or Google Sheets, ready for a client report or a pivot table.
- No 1,000-row cap
- Monthly, weekly or quarterly periods
- Your filters and sort order carry over
Don't let quiet declines become painful surprises
SEO issues rarely announce themselves. They show up slowly:
- a top page loses a third of its clicks in a month
- a whole section slides a little every week
- a once-strong page starts bleeding clicks
SEO Heatmap helps you catch the signal early — before it shows up in traffic
Find growing and falling pages in one click
Pick a streak from 1 to 5 months and see only the pages that gained, or lost, clicks every single month. Works with weeks and quarters too.
Growing: double down
Pages that gained clicks every month, 3 months in a row. Give them fresh internal links and updates while they climb.
Falling: refresh first
Pages that lost clicks every month, 3 months in a row. Catch these quiet declines before they turn into a traffic drop.
From Search Console to priorities in three steps
Connect Google Search Console (read-only)
Sign in with Google and pick a property. SEO Heatmap pulls every page; you can revoke access anytime.
Pick your view
Weekly, monthly or quarterly. Compare any two periods, or filter to one section of the site.
Work the list
Falling pages to refresh, growing pages to double down on. Export it, or ask Claude or ChatGPT for the summary.
Built for teams who ship

SEO specialists & leads
Spot movers across thousands of pages and report progress with year-over-year comparisons

Agencies
Switch between client properties and export client-ready heatmaps in one click

Content teams
Get a refresh list from the Falling filter instead of guessing

Founders
See what's working without spreadsheets
Growth marketers
Focus on pages that drive signups, not vanity metrics
Your data stays yours

Google OAuth connection
You control access
Read-only Search Console access
We can only view your data

Disconnect anytime
Revoke access from your Google account
Frequently asked questions

See your next SEO wins in minutes — free
Connect Google Search Console and turn messy page data into clear priorities.